Ionotropic Glutamate Receptor 5
(All numbering and residues are taken from first PDB file)
![]()
![]()
Bending Residue Dihedral Analysis
Residue
iResidue
i+1Distance of hinge axis to residue i in
(A) Distance of hinge axis to residue i in
(A) Change in
(deg) Change in
(deg) Angle of psi(i) axis to hinge axis
(deg) Angle of psi(i) axis to hinge axis
(deg) Percentage Progress
MET-106
THR-107
6.8
6.8
2.5
18.3
40.3
44.0
67.7
THR-107
LEU-108
4.3
4.0
21.6
-12.4
117.7
117.2
-33.5
LEU-108
GLY-109
1.2
0.2
-7.0
21.7
131.1
138.5
52.2
GLY-109
ILE-110
3.3
3.1
-5.8
0.6
57.9
63.5
-7.4
ILE-110
SER-111
6.7
6.6
-2.9
-3.6
73.7
73.4
33.4
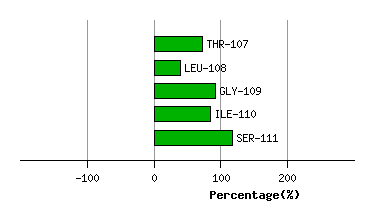
Graph shows rotational transition at bending residues and can be used
to identify hinge bending residues.
Probably only informative for interdomain rotations greater than 20 degrees
Residue
iResidue
i+1Distance of hinge axis to residue i in
(A) Distance of hinge axis to residue i in
(A) Change in
(deg) Change in
(deg) Angle of psi(i) axis to hinge axis
(deg) Angle of psi(i) axis to hinge axis
(deg) Percentage Progress
ILE-211
ASP-212
8.6
8.5
9.1
-11.9
137.4
132.5
19.7
ASP-212
SER-213
5.3
5.0
-5.5
6.4
110.2
117.7
-0.3
SER-213
LYS-214
2.0
1.9
-19.3
11.3
78.8
78.6
21.9
LYS-214
GLY-215
1.8
1.9
30.0
-13.2
45.7
40.5
70.4
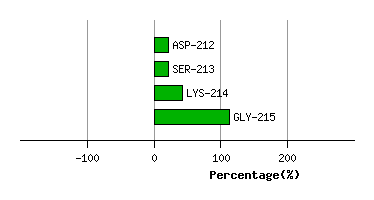
Graph shows rotational transition at bending residues and can be used
to identify hinge bending residues.
Probably only informative for interdomain rotations greater than 20 degrees
Residue
iResidue
i+1Distance of hinge axis to residue i in
(A) Distance of hinge axis to residue i in
(A) Change in
(deg) Change in
(deg) Angle of psi(i) axis to hinge axis
(deg) Angle of psi(i) axis to hinge axis
(deg) Percentage Progress
TRP-250
TRP-251
5.9
5.9
12.4
-7.8
86.8
85.1
-3.4
TRP-251
ARG-252
3.0
2.7
2.7
-84.1
135.9
137.8
253.1
ARG-252
GLY-253
4.7
3.9
-114.2
-89.0
41.0
31.3
-669.3
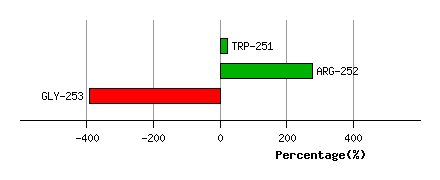
Graph shows rotational transition at bending residues and can be used
to identify hinge bending residues.
Probably only informative for interdomain rotations greater than 20 degrees