Bovine Mitochondrial F1-Atpase
(All numbering and residues are taken from first PDB file)
![]()
![]()
Bending Residue Dihedral Analysis
Residue
iResidue
i+1Distance of hinge axis to residue i in
(A) Distance of hinge axis to residue i in
(A) Change in
(deg) Change in
(deg) Angle of psi(i) axis to hinge axis
(deg) Angle of psi(i) axis to hinge axis
(deg) Percentage Progress
PRO-363
ALA-364
6.5
6.9
6.2
-9.2
20.8
25.3
-18.9
ALA-364
ILE-365
6.8
7.1
0.0
-11.1
77.4
74.6
33.5
ILE-365
ASN-366
6.7
6.8
-6.6
10.0
140.5
129.0
-58.9
ASN-366
VAL-367
6.6
6.6
-16.6
-10.6
73.4
64.8
127.7
VAL-367
GLY-368
7.5
7.5
22.7
-14.9
51.0
52.6
-11.3
GLY-368
LEU-369
9.5
8.9
24.6
-23.9
85.5
68.1
-58.2
LEU-369
SER-370
11.4
11.0
-11.0
24.5
30.9
43.0
-65.4
SER-370
VAL-371
12.1
12.1
9.4
16.9
111.9
108.8
-254.1
VAL-371
SER-372
14.8
15.3
-19.2
-25.4
34.0
20.2
392.0
SER-372
ARG-373
16.8
17.0
-28.1
22.4
96.9
86.4
24.3
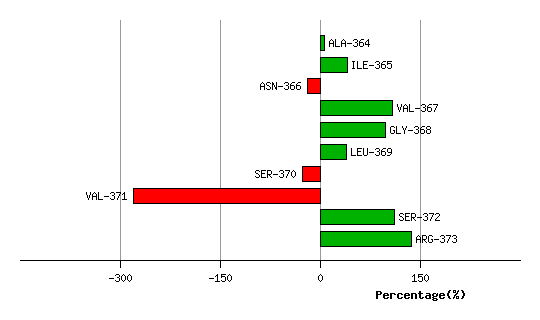
Graph shows rotational transition at bending residues and can be used
to identify hinge bending residues.
Probably only informative for interdomain rotations greater than 20 degrees
Residue
iResidue
i+1Distance of hinge axis to residue i in
(A) Distance of hinge axis to residue i in
(A) Change in
(deg) Change in
(deg) Angle of psi(i) axis to hinge axis
(deg) Angle of psi(i) axis to hinge axis
(deg) Percentage Progress
MET-383
LYS-384
11.9
11.4
-9.8
10.0
136.8
138.3
-42.2
LYS-384
GLN-385
15.2
14.7
-7.1
-0.4
97.5
109.2
29.5
GLN-385
VAL-386
15.8
15.5
-2.0
-7.7
131.0
126.9
-170.5
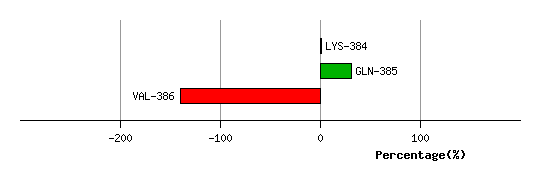
Graph shows rotational transition at bending residues and can be used
to identify hinge bending residues.
Probably only informative for interdomain rotations greater than 20 degrees
Residue
iResidue
i+1Distance of hinge axis to residue i in
(A) Distance of hinge axis to residue i in
(A) Change in
(deg) Change in
(deg) Angle of psi(i) axis to hinge axis
(deg) Angle of psi(i) axis to hinge axis
(deg) Percentage Progress
ARG-423
LEU-424
9.1
9.1
-1.5
-2.8
115.9
117.4
44.4
LEU-424
THR-425
7.1
7.0
6.0
-4.2
99.6
104.6
-40.6
THR-425
GLU-426
4.1
4.1
-3.6
0.5
126.1
125.9
-30.5
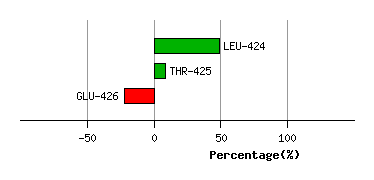
Graph shows rotational transition at bending residues and can be used
to identify hinge bending residues.
Probably only informative for interdomain rotations greater than 20 degrees
Residue
iResidue
i+1Distance of hinge axis to residue i in
(A) Distance of hinge axis to residue i in
(A) Change in
(deg) Change in
(deg) Angle of psi(i) axis to hinge axis
(deg) Angle of psi(i) axis to hinge axis
(deg) Percentage Progress
VAL-444
ILE-445
6.5
6.2
-13.0
6.3
142.0
141.3
-152.9
ILE-445
TYR-446
7.6
7.4
-10.9
7.3
85.3
85.0
69.9
TYR-446
ALA-447
11.0
10.8
3.9
-0.5
66.7
72.3
4.0
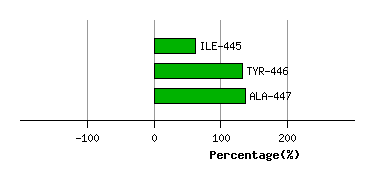
Graph shows rotational transition at bending residues and can be used
to identify hinge bending residues.
Probably only informative for interdomain rotations greater than 20 degrees