G-Protein-Signaling Modulator 2
(All numbering and residues are taken from first PDB file)
![]()
![]()
Bending Residue Dihedral Analysis
Residue
iResidue
i+1Distance of hinge axis to residue i in
(A) Distance of hinge axis to residue i in
(A) Change in
(deg) Change in
(deg) Angle of psi(i) axis to hinge axis
(deg) Angle of psi(i) axis to hinge axis
(deg) Percentage Progress
ALA-147
LYS-148
10.0
9.8
7.3
-7.7
41.1
39.7
-7.2
LYS-148
GLY-149
11.3
11.0
0.3
-12.1
32.0
32.0
-82.4
GLY-149
LYS-150
8.3
8.1
3.3
13.5
61.2
66.6
70.4
LYS-150
SER-151
9.5
8.4
-43.8
30.9
106.3
118.7
-43.9
SER-151
PHE-152
13.0
12.1
-53.8
35.3
156.1
160.2
-154.2
PRO-164
GLU-165
8.2
8.8
-13.9
12.0
47.8
38.5
65.1
GLU-165
GLU-166
9.5
10.1
-11.1
5.8
28.1
20.1
44.8
GLU-166
VAL-167
11.1
11.4
-3.0
9.4
55.6
61.6
8.7
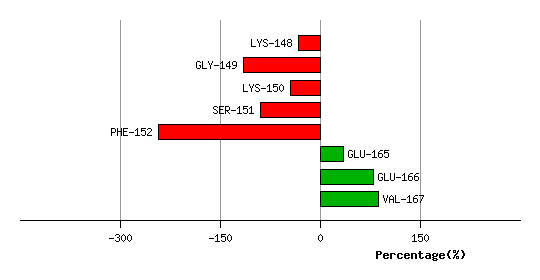
Graph shows rotational transition at bending residues and can be used
to identify hinge bending residues.
Probably only informative for interdomain rotations greater than 20 degrees
Residue
iResidue
i+1Distance of hinge axis to residue i in
(A) Distance of hinge axis to residue i in
(A) Change in
(deg) Change in
(deg) Angle of psi(i) axis to hinge axis
(deg) Angle of psi(i) axis to hinge axis
(deg) Percentage Progress
ARG-168
ASP-169
6.4
6.3
5.2
1.9
41.8
40.1
68.1
ASP-169
ALA-170
9.5
9.4
-0.3
-3.4
150.6
150.4
-27.4
ALA-170
LEU-171
8.8
8.8
3.1
1.5
65.3
66.8
28.2
LEU-171
GLN-172
5.0
5.0
-1.2
-2.4
111.3
114.7
-17.3
GLN-172
ALA-173
6.6
6.5
0.4
1.7
29.2
28.8
1.6
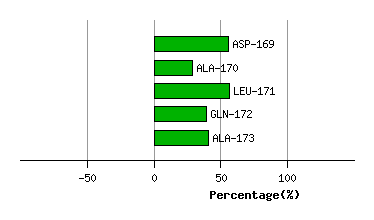
Graph shows rotational transition at bending residues and can be used
to identify hinge bending residues.
Probably only informative for interdomain rotations greater than 20 degrees
Residue
iResidue
i+1Distance of hinge axis to residue i in
(A) Distance of hinge axis to residue i in
(A) Change in
(deg) Change in
(deg) Angle of psi(i) axis to hinge axis
(deg) Angle of psi(i) axis to hinge axis
(deg) Percentage Progress
VAL-175
ASP-176
4.7
4.4
-5.1
0.6
130.7
132.3
-13.8
ASP-176
PHE-177
8.0
7.8
11.9
-7.7
21.1
25.1
38.2
PHE-177
TYR-178
7.1
6.8
1.1
-4.2
64.5
58.9
2.4
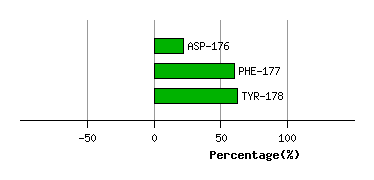
Graph shows rotational transition at bending residues and can be used
to identify hinge bending residues.
Probably only informative for interdomain rotations greater than 20 degrees
Residue
iResidue
i+1Distance of hinge axis to residue i in
(A) Distance of hinge axis to residue i in
(A) Change in
(deg) Change in
(deg) Angle of psi(i) axis to hinge axis
(deg) Angle of psi(i) axis to hinge axis
(deg) Percentage Progress
VAL-185
THR-186
5.0
4.4
12.4
14.4
104.1
102.3
-125.3
THR-186
ALA-187
8.1
7.7
-16.0
6.5
41.5
29.2
85.4
ALA-187
LEU-188
9.9
8.9
-5.3
4.2
30.4
41.0
29.3
LEU-188
GLY-189
6.9
5.6
-4.8
-7.6
74.5
75.9
46.7
GLY-189
ASP-190
7.6
6.4
18.5
-17.5
83.7
80.1
39.5
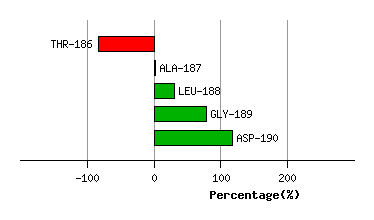
Graph shows rotational transition at bending residues and can be used
to identify hinge bending residues.
Probably only informative for interdomain rotations greater than 20 degrees
Residue
iResidue
i+1Distance of hinge axis to residue i in
(A) Distance of hinge axis to residue i in
(A) Change in
(deg) Change in
(deg) Angle of psi(i) axis to hinge axis
(deg) Angle of psi(i) axis to hinge axis
(deg) Percentage Progress
GLY-195
ARG-196
7.0
6.8
-2.1
2.6
52.3
50.1
0.9
ARG-196
ALA-197
4.9
5.2
-8.3
-7.6
49.6
44.4
141.6
ALA-197
PHE-198
2.4
2.1
10.0
-1.3
140.9
133.1
-60.8
PHE-198
GLY-199
5.6
5.2
-0.2
-0.3
47.2
43.5
-13.9
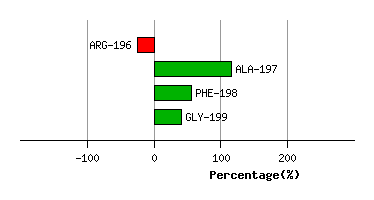
Graph shows rotational transition at bending residues and can be used
to identify hinge bending residues.
Probably only informative for interdomain rotations greater than 20 degrees
Residue
iResidue
i+1Distance of hinge axis to residue i in
(A) Distance of hinge axis to residue i in
(A) Change in
(deg) Change in
(deg) Angle of psi(i) axis to hinge axis
(deg) Angle of psi(i) axis to hinge axis
(deg) Percentage Progress
ASN-200
LEU-201
3.4
3.9
0.4
4.9
53.6
57.8
54.2
LEU-201
GLY-202
2.6
2.2
-7.6
10.3
140.9
139.4
11.2
GLY-202
ASN-203
5.5
5.4
-3.8
0.2
132.7
140.6
-37.9
ASN-203
THR-204
4.9
5.1
9.9
-9.9
56.3
58.0
5.1
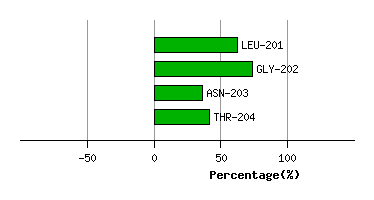
Graph shows rotational transition at bending residues and can be used
to identify hinge bending residues.
Probably only informative for interdomain rotations greater than 20 degrees