Aspartate Aminotransferase (E.C.2.6.1.1)
(All numbering and residues are taken from first PDB file)
![]()
![]()
Bending Residue Dihedral Analysis
Residue
iResidue
i+1Distance of hinge axis to residue i in
(A) Distance of hinge axis to residue i in
(A) Change in
(deg) Change in
(deg) Angle of psi(i) axis to hinge axis
(deg) Angle of psi(i) axis to hinge axis
(deg) Percentage Progress
MET-33
ASN-34
15.6
15.4
4.4
-5.3
50.9
53.0
25.9
ASN-34
LEU-35
14.1
13.7
1.5
6.8
78.2
77.4
2.1
LEU-35
GLY-36
10.9
10.6
-5.5
-30.1
142.3
128.1
-132.3
GLY-36
VAL-37
11.6
11.2
79.6
10.1
98.7
125.6
-224.9
VAL-37
GLY-38
10.8
10.6
-24.2
-27.3
53.3
97.0
55.6
GLY-38
ALA-39
7.8
9.6
-52.5
-14.8
21.2
37.1
387.2
ALA-39
TYR-40
8.9
9.0
32.5
0.8
129.1
119.7
-50.3
TYR-40
ARG-41
6.5
6.2
11.4
-5.6
134.0
128.1
19.5
ARG-41
ASP-42
7.6
7.2
-6.3
1.8
51.2
55.7
23.8
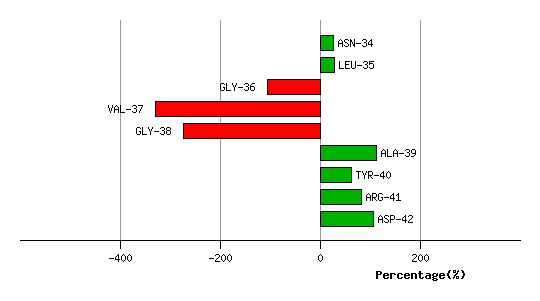
Graph shows rotational transition at bending residues and can be used
to identify hinge bending residues.
Probably only informative for interdomain rotations greater than 20 degrees
Residue
iResidue
i+1Distance of hinge axis to residue i in
(A) Distance of hinge axis to residue i in
(A) Change in
(deg) Change in
(deg) Angle of psi(i) axis to hinge axis
(deg) Angle of psi(i) axis to hinge axis
(deg) Percentage Progress
GLU-322
VAL-323
6.3
6.4
-11.5
7.0
5.6
6.0
66.8
VAL-323
LYS-324
7.2
7.3
-7.5
9.5
76.8
73.9
-25.7
LYS-324
GLY-325
7.1
7.4
3.9
-3.6
82.3
82.4
21.4
GLY-325
MET-326
3.9
4.1
-1.3
9.6
45.4
40.4
-29.8
MET-326
ALA-327
2.0
2.4
-15.1
15.3
36.0
39.8
0.2
ALA-327
ASP-328
3.8
4.4
-9.5
3.6
96.5
95.8
-0.2
ASP-328
ARG-329
5.6
5.8
3.8
3.9
94.7
95.3
56.4
ARG-329
ILE-330
3.9
3.9
-2.7
-1.8
22.0
17.6
1.5
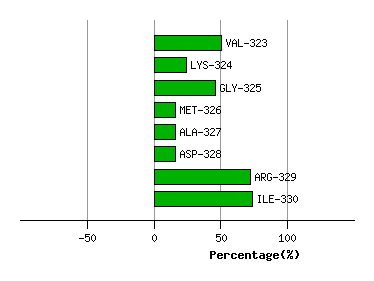
Graph shows rotational transition at bending residues and can be used
to identify hinge bending residues.
Probably only informative for interdomain rotations greater than 20 degrees
Residue
iResidue
i+1Distance of hinge axis to residue i in
(A) Distance of hinge axis to residue i in
(A) Change in
(deg) Change in
(deg) Angle of psi(i) axis to hinge axis
(deg) Angle of psi(i) axis to hinge axis
(deg) Percentage Progress
GLN-356
ILE-357
5.8
6.4
8.7
-10.9
152.3
155.4
9.0
ILE-357
GLY-358
5.0
5.6
-24.5
-7.0
86.5
81.8
69.6
GLY-358
MET-359
3.0
3.2
-3.9
21.4
67.2
86.2
27.7
MET-359
PHE-360
1.6
1.5
-20.8
21.1
127.4
142.5
-5.2
PHE-360
CYS-361
2.3
1.8
-36.8
2.0
114.3
114.8
-117.8
CYS-361
PHE-362
4.1
3.1
-10.4
19.8
145.5
148.2
39.4
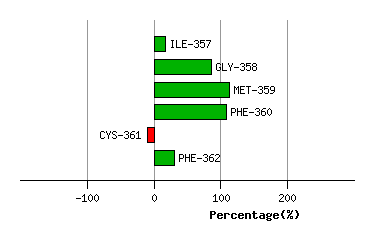
Graph shows rotational transition at bending residues and can be used
to identify hinge bending residues.
Probably only informative for interdomain rotations greater than 20 degrees