Glutamate Receptor, Ionotropic Kainate 1
(All numbering and residues are taken from first PDB file)
![]()
![]()
Bending Residue Dihedral Analysis
Residue
iResidue
i+1Distance of hinge axis to residue i in
(A) Distance of hinge axis to residue i in
(A) Change in
(deg) Change in
(deg) Angle of psi(i) axis to hinge axis
(deg) Angle of psi(i) axis to hinge axis
(deg) Percentage Progress
PHE-105
MET-106
11.6
11.2
10.0
-25.2
122.8
125.2
19.7
MET-106
THR-107
8.3
7.9
0.9
14.6
42.8
49.0
34.1
THR-107
LEU-108
7.1
5.9
28.4
-21.0
114.3
118.3
-30.1
LEU-108
GLY-109
4.5
3.1
-9.5
15.8
134.2
134.2
5.9
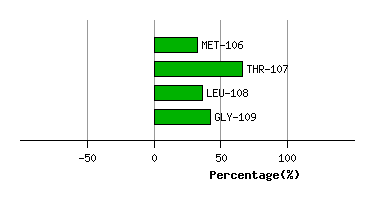
Graph shows rotational transition at bending residues and can be used
to identify hinge bending residues.
Probably only informative for interdomain rotations greater than 20 degrees
Residue
iResidue
i+1Distance of hinge axis to residue i in
(A) Distance of hinge axis to residue i in
(A) Change in
(deg) Change in
(deg) Angle of psi(i) axis to hinge axis
(deg) Angle of psi(i) axis to hinge axis
(deg) Percentage Progress
GLY-209
LEU-210
12.5
11.7
-6.2
22.1
75.5
57.9
-22.9
LEU-210
ILE-211
9.1
8.5
6.3
-1.8
153.6
156.5
-7.4
ILE-211
ASP-212
8.6
9.1
-147.6
135.4
67.7
43.7
-24.8
ASP-212
SER-213
5.8
5.9
117.1
-95.2
75.0
60.5
36.4
SER-213
LYS-214
5.4
4.6
-12.2
13.0
76.6
69.7
17.5
LYS-214
GLY-215
3.4
2.9
19.8
-8.9
42.9
39.4
20.5
GLY-215
TYR-216
5.5
4.9
12.5
-8.7
80.0
84.4
21.2
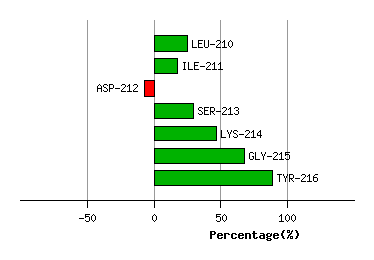
Graph shows rotational transition at bending residues and can be used
to identify hinge bending residues.
Probably only informative for interdomain rotations greater than 20 degrees
Residue
iResidue
i+1Distance of hinge axis to residue i in
(A) Distance of hinge axis to residue i in
(A) Change in
(deg) Change in
(deg) Angle of psi(i) axis to hinge axis
(deg) Angle of psi(i) axis to hinge axis
(deg) Percentage Progress
TRP-251
ARG-252
4.5
4.8
17.8
-3.1
148.4
144.9
-31.6
ARG-252
GLY-253
5.4
6.2
8.7
-93.7
127.8
130.4
171.5
GLY-253
ASN-254
2.7
4.0
-28.4
45.1
27.4
62.0
-49.8
ASN-254
GLY-255
3.4
4.9
-66.7
-31.3
70.7
121.8
-35.8
GLY-255
CYS-256
6.4
6.3
45.3
21.8
73.7
110.6
-2.7
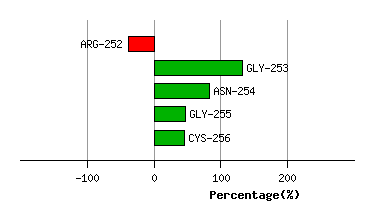
Graph shows rotational transition at bending residues and can be used
to identify hinge bending residues.
Probably only informative for interdomain rotations greater than 20 degrees