Pyruvate Kinase
(All numbering and residues are taken from first PDB file)
![]()
![]()
Bending Residue Dihedral Analysis
Residue
iResidue
i+1Distance of hinge axis to residue i in
(A) Distance of hinge axis to residue i in
(A) Change in
(deg) Change in
(deg) Angle of psi(i) axis to hinge axis
(deg) Angle of psi(i) axis to hinge axis
(deg) Percentage Progress
PRO-1916
GLU-1917
7.7
6.9
-11.3
46.3
126.9
121.9
68.6
GLU-1917
ILE-1918
5.3
5.1
-10.3
-13.8
57.2
61.3
26.9
ILE-1918
ARG-1919
3.1
2.6
-3.4
3.5
108.6
111.3
26.4
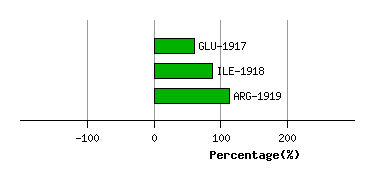
Graph shows rotational transition at bending residues and can be used
to identify hinge bending residues.
Probably only informative for interdomain rotations greater than 20 degrees
Residue
iResidue
i+1Distance of hinge axis to residue i in
(A) Distance of hinge axis to residue i in
(A) Change in
(deg) Change in
(deg) Angle of psi(i) axis to hinge axis
(deg) Angle of psi(i) axis to hinge axis
(deg) Percentage Progress
VAL-2008
ASN-2009
3.8
3.4
3.0
3.0
105.5
103.7
35.7
ASN-2009
LEU-2010
1.0
1.2
13.9
-2.8
90.0
85.4
-39.9
LEU-2010
PRO-2011
3.9
4.7
13.7
-14.5
118.0
121.1
-36.6
PRO-2011
GLY-2012
5.3
6.1
-155.2
-170.5
100.7
99.9
72.2
GLY-2012
ALA-2013
9.0
9.7
-36.2
27.2
165.2
154.0
19.1
ALA-2013
ALA-2014
8.4
9.4
-4.0
-3.7
124.9
103.6
-102.7
ALA-2014
VAL-2015
9.3
10.5
0.0
42.5
125.5
137.8
115.8
VAL-2015
ASP-2016
6.4
7.3
33.2
-16.3
66.5
47.0
73.8
VAL-2015
ASP-2016
6.4
7.3
33.2
-16.3
66.5
47.0
73.8
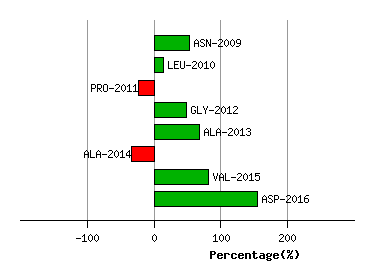
Graph shows rotational transition at bending residues and can be used
to identify hinge bending residues.
Probably only informative for interdomain rotations greater than 20 degrees
Residue
iResidue
i+1Distance of hinge axis to residue i in
(A) Distance of hinge axis to residue i in
(A) Change in
(deg) Change in
(deg) Angle of psi(i) axis to hinge axis
(deg) Angle of psi(i) axis to hinge axis
(deg) Percentage Progress
VAL-2015
ASP-2016
6.4
7.3
33.2
-16.3
66.5
47.0
73.8
VAL-2015
ASP-2016
6.4
7.3
33.2
-16.3
66.5
47.0
73.8
ASP-2016
LEU-2017
8.3
8.5
-72.5
46.3
121.5
120.9
-75.4
LEU-2017
PRO-2018
7.3
6.7
-6.2
12.3
89.5
87.7
3.0
PRO-2018
ALA-2019
10.5
9.9
-6.2
-1.6
45.1
38.0
28.2
ALA-2019
VAL-2020
12.9
12.1
-2.4
5.5
110.7
108.4
-3.0
VAL-2020
SER-2021
13.5
13.2
-11.0
10.0
145.4
149.6
-7.0
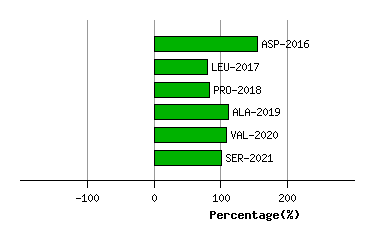
Graph shows rotational transition at bending residues and can be used
to identify hinge bending residues.
Probably only informative for interdomain rotations greater than 20 degrees