Glutamine Abc Transporter Permease And Substrate Binding Protein Protein
(All numbering and residues are taken from first PDB file)
![]()
![]()
Bending Residue Dihedral Analysis
Residue
iResidue
i+1Distance of hinge axis to residue i in
(A) Distance of hinge axis to residue i in
(A) Change in
(deg) Change in
(deg) Angle of psi(i) axis to hinge axis
(deg) Angle of psi(i) axis to hinge axis
(deg) Percentage Progress
VAL-137
GLY-138
2.3
2.2
2.2
4.2
102.5
102.5
-123.8
GLY-138
ALA-139
1.4
1.4
-5.5
1.5
13.6
16.3
129.1
ALA-139
LYS-140
3.6
3.6
-0.6
-2.1
96.0
94.8
65.3
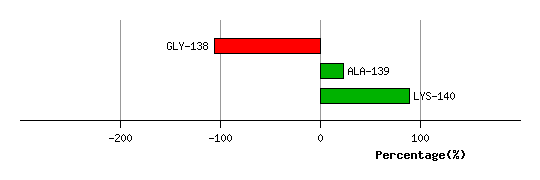
Graph shows rotational transition at bending residues and can be used
to identify hinge bending residues.
Probably only informative for interdomain rotations greater than 20 degrees
Residue
iResidue
i+1Distance of hinge axis to residue i in
(A) Distance of hinge axis to residue i in
(A) Change in
(deg) Change in
(deg) Angle of psi(i) axis to hinge axis
(deg) Angle of psi(i) axis to hinge axis
(deg) Percentage Progress
TRP-148
LEU-149
6.4
6.5
-1.1
0.5
23.6
24.7
-9.5
LEU-149
GLN-150
6.2
6.2
-0.6
-3.3
73.9
73.4
91.4
GLN-150
GLU-151
9.7
9.6
3.1
9.7
63.7
62.9
-8.1
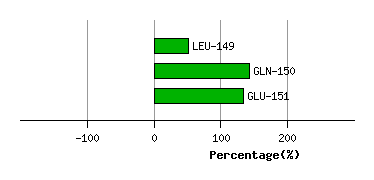
Graph shows rotational transition at bending residues and can be used
to identify hinge bending residues.
Probably only informative for interdomain rotations greater than 20 degrees
Residue
iResidue
i+1Distance of hinge axis to residue i in
(A) Distance of hinge axis to residue i in
(A) Change in
(deg) Change in
(deg) Angle of psi(i) axis to hinge axis
(deg) Angle of psi(i) axis to hinge axis
(deg) Percentage Progress
TYR-158
THR-159
8.4
8.4
-1.2
-0.7
110.2
107.9
9.5
THR-159
ILE-160
6.8
6.8
-4.9
5.8
57.3
58.8
23.7
ILE-160
LYS-161
5.2
5.2
-5.2
8.7
122.4
123.4
29.4
LYS-161
THR-162
4.3
4.3
-9.4
7.4
38.4
40.3
83.3
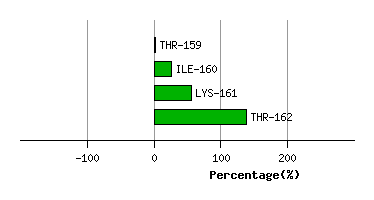
Graph shows rotational transition at bending residues and can be used
to identify hinge bending residues.
Probably only informative for interdomain rotations greater than 20 degrees
Residue
iResidue
i+1Distance of hinge axis to residue i in
(A) Distance of hinge axis to residue i in
(A) Change in
(deg) Change in
(deg) Angle of psi(i) axis to hinge axis
(deg) Angle of psi(i) axis to hinge axis
(deg) Percentage Progress
ASN-177
ILE-178
3.9
4.0
9.5
-2.1
41.0
40.4
151.5
ILE-178
ALA-179
3.2
3.2
-1.8
3.9
105.1
105.3
10.7
ALA-179
GLY-180
6.2
6.1
1.1
-2.2
15.7
15.5
-73.3
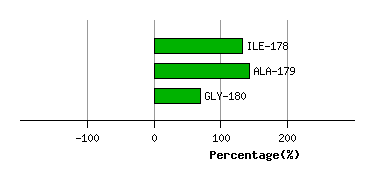
Graph shows rotational transition at bending residues and can be used
to identify hinge bending residues.
Probably only informative for interdomain rotations greater than 20 degrees