Tyrosyl-Trna Synthetase
(All numbering and residues are taken from first PDB file)
![]()
![]()
Bending Residue Dihedral Analysis
Residue
iResidue
i+1Distance of hinge axis to residue i in
(A) Distance of hinge axis to residue i in
(A) Change in
(deg) Change in
(deg) Angle of psi(i) axis to hinge axis
(deg) Angle of psi(i) axis to hinge axis
(deg) Percentage Progress
GLY-41
THR-42
6.1
6.1
-4.7
-6.2
94.6
97.2
-33.7
THR-42
ALA-43
4.6
5.1
-5.6
-24.4
63.2
54.3
147.8
ALA-43
THR-44
7.6
8.3
-44.3
59.6
41.8
60.5
-122.9
THR-44
THR-45
7.9
8.4
50.3
-11.8
96.2
82.1
32.6
THR-45
GLY-46
11.3
11.2
-52.3
-20.2
100.1
81.5
-95.6
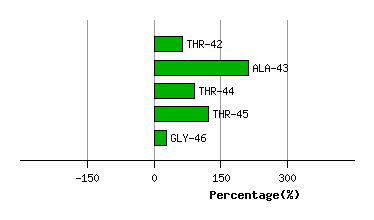
Graph shows rotational transition at bending residues and can be used
to identify hinge bending residues.
Probably only informative for interdomain rotations greater than 20 degrees
Residue
iResidue
i+1Distance of hinge axis to residue i in
(A) Distance of hinge axis to residue i in
(A) Change in
(deg) Change in
(deg) Angle of psi(i) axis to hinge axis
(deg) Angle of psi(i) axis to hinge axis
(deg) Percentage Progress
LYS-47
PRO-48
11.6
11.3
20.9
6.2
49.3
38.0
125.2
PRO-48
HIS-49
9.5
8.7
-0.2
6.2
100.3
112.6
67.2
HIS-49
VAL-50
11.7
10.4
-1.4
2.4
118.1
111.5
6.5
VAL-50
ALA-51
11.8
10.7
2.2
-2.0
44.7
48.7
-31.7
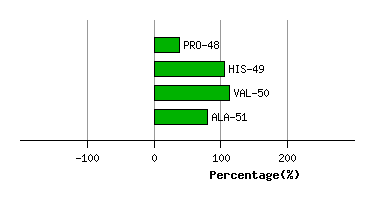
Graph shows rotational transition at bending residues and can be used
to identify hinge bending residues.
Probably only informative for interdomain rotations greater than 20 degrees
Residue
iResidue
i+1Distance of hinge axis to residue i in
(A) Distance of hinge axis to residue i in
(A) Change in
(deg) Change in
(deg) Angle of psi(i) axis to hinge axis
(deg) Angle of psi(i) axis to hinge axis
(deg) Percentage Progress
PRO-55
MET-56
3.7
3.9
0.6
-3.6
45.6
45.3
-19.2
MET-56
SER-57
6.0
6.4
-6.7
-0.5
68.5
70.1
36.1
SER-57
LYS-58
9.0
9.4
-0.1
3.6
72.6
76.1
0.3
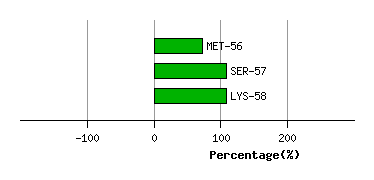
Graph shows rotational transition at bending residues and can be used
to identify hinge bending residues.
Probably only informative for interdomain rotations greater than 20 degrees
Residue
iResidue
i+1Distance of hinge axis to residue i in
(A) Distance of hinge axis to residue i in
(A) Change in
(deg) Change in
(deg) Angle of psi(i) axis to hinge axis
(deg) Angle of psi(i) axis to hinge axis
(deg) Percentage Progress
LEU-76
HIS-77
14.5
14.4
6.8
1.8
41.5
20.3
33.6
HIS-77
ALA-78
14.6
13.7
4.2
-4.7
105.0
88.2
-1.1
ALA-78
TYR-79
13.7
12.9
10.2
-9.2
123.0
103.2
16.6
TYR-79
LEU-80
16.4
16.4
8.7
-16.2
57.0
39.5
6.1
LEU-80
ASP-81
19.0
17.9
16.4
-5.1
51.9
33.3
30.4
ASP-81
ASN-82
18.5
16.6
83.7
-151.3
124.2
101.9
147.7
ASN-82
MET-83
19.6
19.8
-36.4
114.5
24.1
28.4
-489.3
MET-83
LYS-84
21.1
19.3
63.7
19.7
134.9
92.0
-201.0
LYS-84
ALA-85
22.6
16.7
-13.3
-64.9
72.4
25.9
347.0
ALA-85
PRO-86
19.3
15.3
16.4
-49.2
143.2
120.9
270.2
PRO-86
TRP-87
18.5
18.0
8.1
57.6
92.0
147.3
-236.8
TRP-87
GLU-88
15.9
18.0
-16.5
-42.7
93.0
55.2
84.3
GLU-88
LEU-89
13.0
16.0
49.1
-43.8
37.7
70.3
15.6
LEU-89
LEU-90
13.5
14.6
8.9
7.0
39.3
63.1
63.7
LEU-90
GLU-91
12.3
12.3
6.7
21.0
105.0
119.8
-77.4
GLU-91
LEU-92
9.3
10.0
-19.4
-3.6
76.0
84.7
82.2
LEU-92
ARG-93
8.8
9.3
2.4
0.5
26.1
27.9
5.0
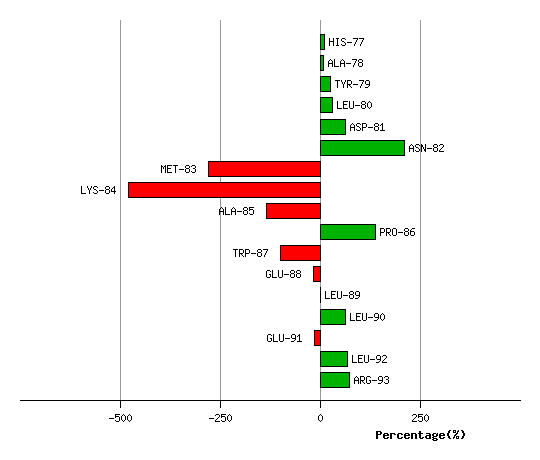
Graph shows rotational transition at bending residues and can be used
to identify hinge bending residues.
Probably only informative for interdomain rotations greater than 20 degrees
Residue
iResidue
i+1Distance of hinge axis to residue i in
(A) Distance of hinge axis to residue i in
(A) Change in
(deg) Change in
(deg) Angle of psi(i) axis to hinge axis
(deg) Angle of psi(i) axis to hinge axis
(deg) Percentage Progress
PHE-117
ILE-118
6.4
6.6
-2.1
7.8
107.8
109.4
11.4
ILE-118
LYS-119
8.5
8.7
-5.3
1.2
79.4
82.7
-1.2
LYS-119
GLY-120
9.0
8.9
-19.5
0.1
67.9
70.2
-1.4
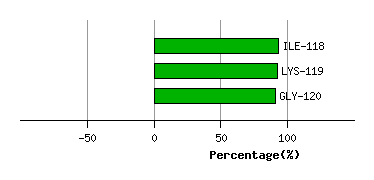
Graph shows rotational transition at bending residues and can be used
to identify hinge bending residues.
Probably only informative for interdomain rotations greater than 20 degrees
Residue
iResidue
i+1Distance of hinge axis to residue i in
(A) Distance of hinge axis to residue i in
(A) Change in
(deg) Change in
(deg) Angle of psi(i) axis to hinge axis
(deg) Angle of psi(i) axis to hinge axis
(deg) Percentage Progress
ASN-212
PRO-213
2.9
3.0
-2.6
1.3
133.3
125.3
-4.7
PRO-213
MET-214
1.8
2.4
-13.4
-3.4
55.0
52.0
76.5
MET-214
VAL-215
3.9
4.3
33.6
4.5
81.0
79.6
175.8
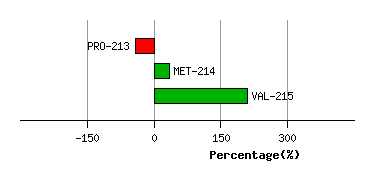
Graph shows rotational transition at bending residues and can be used
to identify hinge bending residues.
Probably only informative for interdomain rotations greater than 20 degrees
Residue
iResidue
i+1Distance of hinge axis to residue i in
(A) Distance of hinge axis to residue i in
(A) Change in
(deg) Change in
(deg) Angle of psi(i) axis to hinge axis
(deg) Angle of psi(i) axis to hinge axis
(deg) Percentage Progress
PHE-263
ILE-264
12.9
12.9
-8.4
1.6
94.6
96.2
-21.3
ILE-264
LYS-265
15.5
15.1
4.0
4.9
106.5
111.9
24.3
LYS-265
HIS-266
13.2
12.6
-4.7
-11.6
132.7
128.4
-56.9
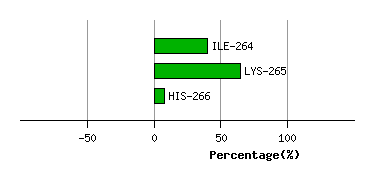
Graph shows rotational transition at bending residues and can be used
to identify hinge bending residues.
Probably only informative for interdomain rotations greater than 20 degrees
Residue
iResidue
i+1Distance of hinge axis to residue i in
(A) Distance of hinge axis to residue i in
(A) Change in
(deg) Change in
(deg) Angle of psi(i) axis to hinge axis
(deg) Angle of psi(i) axis to hinge axis
(deg) Percentage Progress
LEU-268
PHE-269
16.0
15.1
-7.9
1.2
116.0
107.0
1.2
PHE-269
PRO-270
17.2
15.4
-12.8
2.4
66.4
58.2
16.4
PRO-270
LEU-271
15.7
13.2
-17.1
-12.0
28.5
20.6
202.0
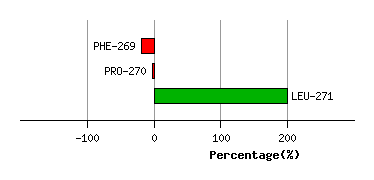
Graph shows rotational transition at bending residues and can be used
to identify hinge bending residues.
Probably only informative for interdomain rotations greater than 20 degrees