Aspartate Aminotransferase
(All numbering and residues are taken from first PDB file)
![]()
![]()
Bending Residue Dihedral Analysis
Residue
iResidue
i+1Distance of hinge axis to residue i in
(A) Distance of hinge axis to residue i in
(A) Change in
(deg) Change in
(deg) Angle of psi(i) axis to hinge axis
(deg) Angle of psi(i) axis to hinge axis
(deg) Percentage Progress
ILE-33
ASN-34
16.0
15.5
-26.0
33.4
125.5
129.4
137.9
ASN-34
LEU-35
14.7
14.5
15.0
-14.7
74.5
73.4
2.1
LEU-35
GLY-36
11.7
11.6
-15.4
-30.1
125.1
127.2
-372.3
GLY-36
ILE-37
13.7
13.3
116.9
-19.3
94.2
120.5
-351.3
ILE-37
GLY-38
13.9
13.1
0.2
-16.7
111.2
70.6
38.1
GLY-38
VAL-39
11.2
12.7
-38.4
-19.9
29.6
42.2
627.4
VAL-39
TYR-40
11.5
11.5
41.9
-23.0
118.0
114.1
0.0
TYR-40
LYS-41
8.3
8.5
-4.8
-3.8
40.0
40.8
90.5
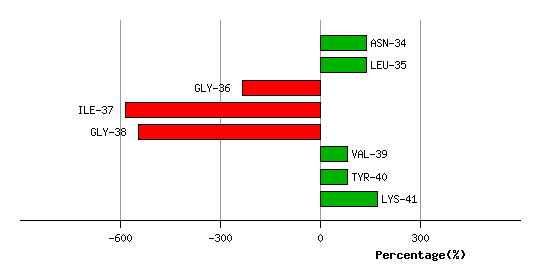
Graph shows rotational transition at bending residues and can be used
to identify hinge bending residues.
Probably only informative for interdomain rotations greater than 20 degrees
Residue
iResidue
i+1Distance of hinge axis to residue i in
(A) Distance of hinge axis to residue i in
(A) Change in
(deg) Change in
(deg) Angle of psi(i) axis to hinge axis
(deg) Angle of psi(i) axis to hinge axis
(deg) Percentage Progress
GLN-331
ARG-332
3.9
4.3
16.9
-1.5
75.8
72.4
73.7
ARG-332
MET-333
5.0
5.3
-16.5
16.1
70.9
60.1
22.4
MET-333
ARG-334
4.2
4.6
-14.2
-1.4
14.1
16.6
216.9
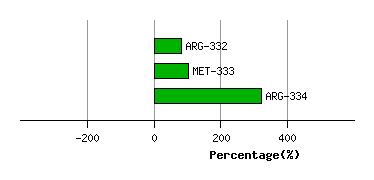
Graph shows rotational transition at bending residues and can be used
to identify hinge bending residues.
Probably only informative for interdomain rotations greater than 20 degrees
Residue
iResidue
i+1Distance of hinge axis to residue i in
(A) Distance of hinge axis to residue i in
(A) Change in
(deg) Change in
(deg) Angle of psi(i) axis to hinge axis
(deg) Angle of psi(i) axis to hinge axis
(deg) Percentage Progress
GLY-345
ALA-346
20.4
20.4
-2.4
51.0
151.3
138.8
638.9
ALA-346
ASN-347
17.6
17.2
-41.2
69.9
134.4
152.6
498.0
ASN-347
ARG-348
17.7
17.9
-13.7
-30.1
113.5
114.4
-362.2
ARG-348
ASP-349
14.1
14.4
42.2
-7.6
127.5
127.6
-405.7
ASP-349
PHE-350
12.3
12.3
-11.5
7.4
80.3
73.0
60.4
PHE-350
SER-351
9.1
9.4
-7.2
-1.2
63.7
67.5
87.2
SER-351
PHE-352
9.2
9.3
-4.9
9.9
101.3
102.6
36.7
PHE-352
ILE-353
6.0
6.2
-2.2
-6.1
45.9
41.3
87.7
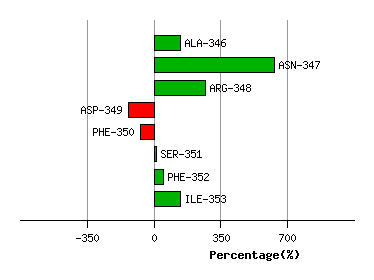
Graph shows rotational transition at bending residues and can be used
to identify hinge bending residues.
Probably only informative for interdomain rotations greater than 20 degrees
Residue
iResidue
i+1Distance of hinge axis to residue i in
(A) Distance of hinge axis to residue i in
(A) Change in
(deg) Change in
(deg) Angle of psi(i) axis to hinge axis
(deg) Angle of psi(i) axis to hinge axis
(deg) Percentage Progress
MET-359
PHE-360
5.3
4.7
9.7
17.6
130.6
138.2
-360.6
PHE-360
SER-361
5.1
5.1
8.9
-57.6
134.8
130.2
632.2
SER-361
PHE-362
3.6
3.6
0.8
8.0
137.5
123.2
-19.7
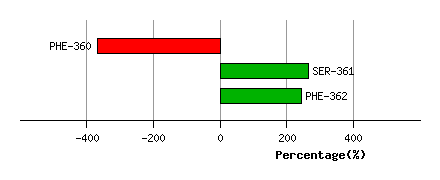
Graph shows rotational transition at bending residues and can be used
to identify hinge bending residues.
Probably only informative for interdomain rotations greater than 20 degrees
Residue
iResidue
i+1Distance of hinge axis to residue i in
(A) Distance of hinge axis to residue i in
(A) Change in
(deg) Change in
(deg) Angle of psi(i) axis to hinge axis
(deg) Angle of psi(i) axis to hinge axis
(deg) Percentage Progress
GLY-385
ARG-386
11.0
10.8
-19.3
3.4
55.3
49.7
257.7
ARG-386
VAL-387
8.9
8.9
0.5
-3.2
152.5
158.1
-45.0
VAL-387
ASN-388
8.6
8.4
7.0
-10.8
130.0
123.1
73.8
ASN-388
VAL-389
7.6
7.2
4.0
7.6
123.6
124.4
-44.2
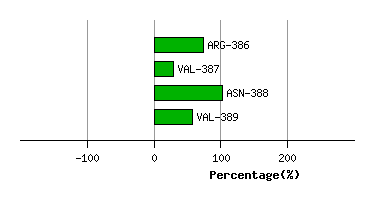
Graph shows rotational transition at bending residues and can be used
to identify hinge bending residues.
Probably only informative for interdomain rotations greater than 20 degrees