S-Adenosyl-L-Homocysteine Hydrolase
(All numbering and residues are taken from first PDB file)
![]()
![]()
Bending Residue Dihedral Analysis
Residue
iResidue
i+1Distance of hinge axis to residue i in
(A) Distance of hinge axis to residue i in
(A) Change in
(deg) Change in
(deg) Angle of psi(i) axis to hinge axis
(deg) Angle of psi(i) axis to hinge axis
(deg) Percentage Progress
THR-184
LYS-185
2.1
2.0
-29.5
20.6
108.2
110.1
-8.0
LYS-185
SER-186
4.8
4.2
29.2
0.9
96.9
103.2
-13.9
SER-186
LYS-187
7.8
6.7
-7.6
15.0
102.5
118.9
-8.3
LYS-187
PHE-188
8.0
7.5
-18.3
31.6
167.1
159.2
86.4
PHE-188
ASP-189
7.3
7.2
-4.3
12.0
121.5
96.2
49.9
ASP-189
ASN-190
8.2
9.2
35.0
-38.1
101.0
105.2
8.6
ASN-190
LEU-191
11.5
11.6
-38.7
12.8
97.6
109.8
-42.0
LEU-191
TYR-192
12.2
12.3
-5.4
14.8
159.7
168.8
46.1
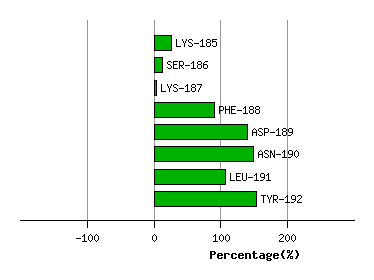
Graph shows rotational transition at bending residues and can be used
to identify hinge bending residues.
Probably only informative for interdomain rotations greater than 20 degrees
Residue
iResidue
i+1Distance of hinge axis to residue i in
(A) Distance of hinge axis to residue i in
(A) Change in
(deg) Change in
(deg) Angle of psi(i) axis to hinge axis
(deg) Angle of psi(i) axis to hinge axis
(deg) Percentage Progress
PRO-353
SER-354
9.2
9.0
6.4
-2.0
74.3
76.2
20.3
SER-354
PHE-355
6.3
6.1
-10.3
4.5
118.9
130.5
5.9
PHE-355
VAL-356
4.0
3.8
21.1
-9.5
6.7
15.2
65.2
VAL-356
MET-357
5.5
5.7
-13.4
8.5
109.6
103.8
9.5
MET-357
SER-358
6.1
6.4
-6.5
4.8
95.3
95.2
31.5
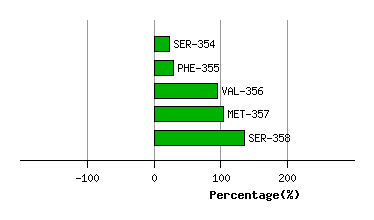
Graph shows rotational transition at bending residues and can be used
to identify hinge bending residues.
Probably only informative for interdomain rotations greater than 20 degrees
Residue
iResidue
i+1Distance of hinge axis to residue i in
(A) Distance of hinge axis to residue i in
(A) Change in
(deg) Change in
(deg) Angle of psi(i) axis to hinge axis
(deg) Angle of psi(i) axis to hinge axis
(deg) Percentage Progress
VAL-382
HIS-383
12.5
12.7
-28.2
20.5
80.7
78.2
39.6
HIS-383
PHE-384
9.7
9.9
-16.0
30.4
136.3
137.2
59.1
PHE-384
LEU-385
6.6
6.6
-9.3
21.5
113.7
123.7
11.0
LEU-385
PRO-386
6.5
6.6
-13.7
-6.9
71.6
69.5
0.9
PRO-386
LYS-387
7.3
7.2
4.4
-2.7
118.8
125.5
8.3
PRO-386
LYS-387
7.3
7.2
4.4
-2.7
118.8
125.5
8.3
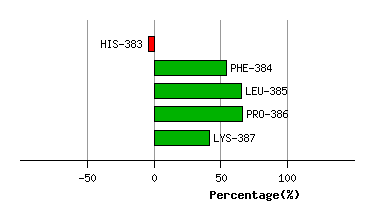
Graph shows rotational transition at bending residues and can be used
to identify hinge bending residues.
Probably only informative for interdomain rotations greater than 20 degrees
Residue
iResidue
i+1Distance of hinge axis to residue i in
(A) Distance of hinge axis to residue i in
(A) Change in
(deg) Change in
(deg) Angle of psi(i) axis to hinge axis
(deg) Angle of psi(i) axis to hinge axis
(deg) Percentage Progress
PRO-386
LYS-387
7.3
7.2
4.4
-2.7
118.8
125.5
8.3
PRO-386
LYS-387
7.3
7.2
4.4
-2.7
118.8
125.5
8.3
LYS-387
LYS-388
5.6
5.6
-6.7
5.1
39.5
44.5
36.8
LYS-388
LEU-389
8.7
8.9
4.9
-4.6
147.9
149.8
-27.0
LEU-389
ASP-390
7.4
7.8
10.9
-14.1
112.2
112.2
14.0
ASP-390
GLU-391
3.8
4.2
10.2
-9.2
124.5
119.3
-10.4
GLU-391
ALA-392
6.3
6.7
3.9
-4.3
152.9
154.4
11.4
ALA-392
VAL-393
7.5
7.9
-1.5
-8.2
47.6
42.0
46.4
VAL-393
ALA-394
4.1
4.7
12.8
5.6
115.4
107.8
-94.5
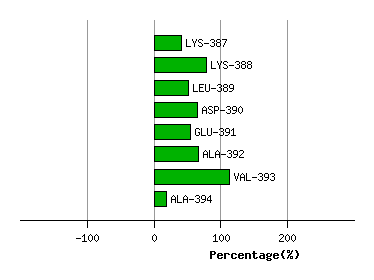
Graph shows rotational transition at bending residues and can be used
to identify hinge bending residues.
Probably only informative for interdomain rotations greater than 20 degrees