Glutamate Receptor 2
(All numbering and residues are taken from first PDB file)
![]()
![]()
Bending Residue Dihedral Analysis
Residue
iResidue
i+1Distance of hinge axis to residue i in
(A) Distance of hinge axis to residue i in
(A) Change in
(deg) Change in
(deg) Angle of psi(i) axis to hinge axis
(deg) Angle of psi(i) axis to hinge axis
(deg) Percentage Progress
PHE-106
MET-107
7.8
7.9
-3.9
-0.1
103.9
106.0
-3.4
MET-107
SER-108
4.1
4.1
-0.5
3.4
27.5
27.0
-21.4
SER-108
LEU-109
2.6
2.7
2.7
-0.3
86.6
87.7
50.5
LEU-109
GLY-110
1.7
1.6
-5.6
-4.6
22.7
22.8
130.7
GLY-110
ILE-111
4.1
4.1
0.6
2.8
87.3
87.5
-42.3
ILE-111
SER-112
7.4
7.5
-6.5
5.6
115.8
115.8
-33.8
SER-112
ILE-113
10.2
10.2
6.4
-8.1
85.3
87.3
8.1
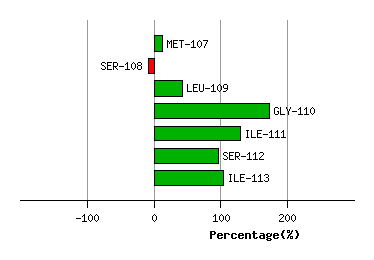
Graph shows rotational transition at bending residues and can be used
to identify hinge bending residues.
Probably only informative for interdomain rotations greater than 20 degrees
Residue
iResidue
i+1Distance of hinge axis to residue i in
(A) Distance of hinge axis to residue i in
(A) Change in
(deg) Change in
(deg) Angle of psi(i) axis to hinge axis
(deg) Angle of psi(i) axis to hinge axis
(deg) Percentage Progress
LEU-215
ASP-216
8.6
8.7
-0.2
-3.6
120.0
117.7
-22.5
ASP-216
SER-217
5.0
5.1
-0.6
0.5
41.1
41.7
-24.9
SER-217
LYS-218
3.0
3.2
-6.2
14.8
95.5
96.1
-17.3
LYS-218
GLY-219
1.4
1.2
-1.9
-7.0
27.0
31.8
134.4
GLY-219
TYR-220
3.8
3.8
-1.7
-5.7
78.2
79.6
-39.7
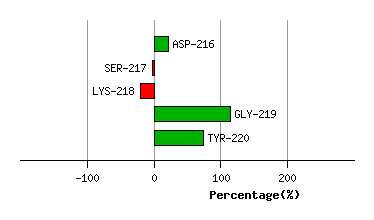
Graph shows rotational transition at bending residues and can be used
to identify hinge bending residues.
Probably only informative for interdomain rotations greater than 20 degrees
Residue
iResidue
i+1Distance of hinge axis to residue i in
(A) Distance of hinge axis to residue i in
(A) Change in
(deg) Change in
(deg) Angle of psi(i) axis to hinge axis
(deg) Angle of psi(i) axis to hinge axis
(deg) Percentage Progress
LYS-253
TRP-254
0.7
0.6
4.2
-3.8
104.0
104.1
-28.7
TRP-254
TRP-255
3.8
3.5
9.9
-16.5
112.1
112.4
58.7
TRP-255
TYR-256
4.5
4.3
4.4
-6.0
48.2
51.7
-15.6
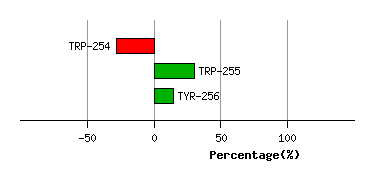
Graph shows rotational transition at bending residues and can be used
to identify hinge bending residues.
Probably only informative for interdomain rotations greater than 20 degrees