Glycogen Synthase
(All numbering and residues are taken from first PDB file)
![]()
![]()
Bending Residue Dihedral Analysis
Residue
iResidue
i+1Distance of hinge axis to residue i in
(A) Distance of hinge axis to residue i in
(A) Change in
(deg) Change in
(deg) Angle of psi(i) axis to hinge axis
(deg) Angle of psi(i) axis to hinge axis
(deg) Percentage Progress
THR-209
ALA-210
4.4
4.7
6.1
-6.1
95.4
95.2
37.1
ALA-210
VAL-211
1.9
2.3
-1.4
-12.2
22.9
24.7
81.6
VAL-211
SER-212
1.9
2.1
11.8
0.3
99.7
101.1
-59.6

Graph shows rotational transition at bending residues and can be used
to identify hinge bending residues.
Probably only informative for interdomain rotations greater than 20 degrees
Residue
iResidue
i+1Distance of hinge axis to residue i in
(A) Distance of hinge axis to residue i in
(A) Change in
(deg) Change in
(deg) Angle of psi(i) axis to hinge axis
(deg) Angle of psi(i) axis to hinge axis
(deg) Percentage Progress
ILE-219
THR-220
5.0
5.1
1.7
-8.7
155.3
153.8
40.3
THR-220
GLU-221
3.5
3.7
18.8
-24.6
126.5
124.5
16.8
GLU-221
PRO-222
7.1
7.4
1.0
2.2
96.0
95.8
31.4
PRO-222
GLN-223
8.8
9.6
0.1
-5.7
55.1
46.1
7.0
GLN-223
PHE-224
11.9
12.2
14.1
-30.8
38.9
34.6
-85.4
PHE-224
ALA-225
9.8
10.2
18.9
-32.1
97.7
100.8
114.2
ALA-225
TYR-226
8.1
8.6
-15.5
14.4
86.9
61.7
58.6
TYR-226
GLY-227
11.6
11.9
-14.7
42.0
42.0
46.7
-117.3
GLY-227
MET-228
10.5
10.4
-22.3
13.0
92.4
98.6
5.7
MET-228
GLU-229
7.8
8.0
-26.2
4.1
75.3
78.5
5.7
GLU-229
GLY-230
5.0
5.1
0.9
-9.3
123.5
127.8
39.4
GLY-230
LEU-231
3.9
3.6
23.9
-10.9
60.4
68.6
-1.5
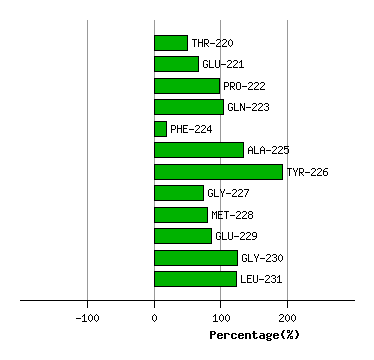
Graph shows rotational transition at bending residues and can be used
to identify hinge bending residues.
Probably only informative for interdomain rotations greater than 20 degrees
Residue
iResidue
i+1Distance of hinge axis to residue i in
(A) Distance of hinge axis to residue i in
(A) Change in
(deg) Change in
(deg) Angle of psi(i) axis to hinge axis
(deg) Angle of psi(i) axis to hinge axis
(deg) Percentage Progress
VAL-244
LEU-245
3.3
3.3
-19.3
8.3
53.7
53.0
94.0
LEU-245
ASN-246
2.4
2.2
-2.0
14.7
44.0
38.7
-141.4
ASN-246
GLY-247
0.6
0.8
-17.4
9.6
25.5
32.8
151.3
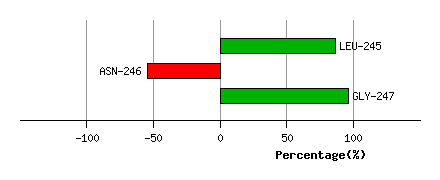
Graph shows rotational transition at bending residues and can be used
to identify hinge bending residues.
Probably only informative for interdomain rotations greater than 20 degrees
Residue
iResidue
i+1Distance of hinge axis to residue i in
(A) Distance of hinge axis to residue i in
(A) Change in
(deg) Change in
(deg) Angle of psi(i) axis to hinge axis
(deg) Angle of psi(i) axis to hinge axis
(deg) Percentage Progress
PHE-460
SER-461
5.5
4.6
51.6
-22.4
65.9
67.4
92.1
SER-461
TRP-462
3.5
3.9
-36.9
-3.9
49.4
53.0
145.4
TRP-462
GLN-463
3.9
4.0
-7.9
-8.0
83.9
86.2
21.6
GLN-463
VAL-464
7.4
7.6
4.3
-3.6
147.1
131.7
36.4
VAL-464
ALA-465
7.3
8.0
8.0
0.9
142.6
152.9
-57.1
ALA-465
ALA-466
5.6
5.9
1.6
-15.0
92.4
101.6
32.6
ALA-466
LYS-467
8.7
8.7
30.6
-12.7
120.9
111.3
-44.0
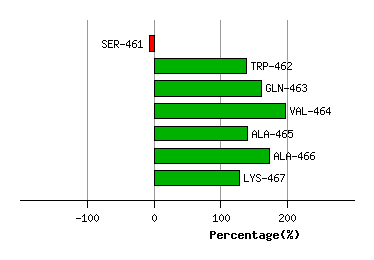
Graph shows rotational transition at bending residues and can be used
to identify hinge bending residues.
Probably only informative for interdomain rotations greater than 20 degrees