Putative Phosphoglycolate Phosphatase
(All numbering and residues are taken from first PDB file)
![]()
![]()
Bending Residue Dihedral Analysis
Residue
iResidue
i+1Distance of hinge axis to residue i in
(A) Distance of hinge axis to residue i in
(A) Change in
(deg) Change in
(deg) Angle of psi(i) axis to hinge axis
(deg) Angle of psi(i) axis to hinge axis
(deg) Percentage Progress
VAL-130
VAL-131
2.5
3.2
10.6
3.7
41.9
54.5
106.3
VAL-131
SER-132
1.3
1.4
34.3
-14.9
75.3
82.7
13.9
SER-132
ASN-133
2.7
2.8
-1.0
4.3
120.7
127.0
-11.1
ASN-133
LYS-134
5.9
5.9
17.7
-27.8
129.7
125.0
57.3
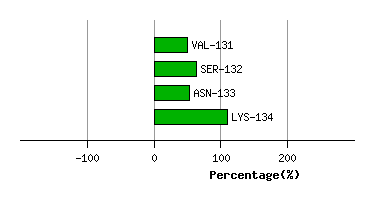
Graph shows rotational transition at bending residues and can be used
to identify hinge bending residues.
Probably only informative for interdomain rotations greater than 20 degrees
Residue
iResidue
i+1Distance of hinge axis to residue i in
(A) Distance of hinge axis to residue i in
(A) Change in
(deg) Change in
(deg) Angle of psi(i) axis to hinge axis
(deg) Angle of psi(i) axis to hinge axis
(deg) Percentage Progress
SER-150
PHE-151
6.8
6.8
3.3
-9.2
156.4
148.2
40.3
PHE-151
ASP-152
6.8
7.1
9.3
-5.8
99.0
88.8
14.2
ASP-152
PHE-153
9.7
10.0
-8.1
9.4
54.3
56.9
-6.1
PHE-153
ALA-154
7.7
8.3
4.8
8.1
92.4
100.0
-29.1
ALA-154
LEU-155
4.7
5.3
11.3
-5.2
122.4
128.0
-32.5
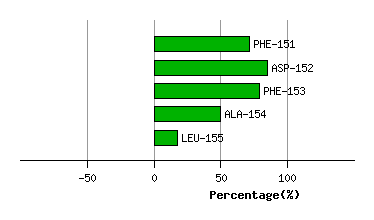
Graph shows rotational transition at bending residues and can be used
to identify hinge bending residues.
Probably only informative for interdomain rotations greater than 20 degrees
Residue
iResidue
i+1Distance of hinge axis to residue i in
(A) Distance of hinge axis to residue i in
(A) Change in
(deg) Change in
(deg) Angle of psi(i) axis to hinge axis
(deg) Angle of psi(i) axis to hinge axis
(deg) Percentage Progress
ARG-162
ARG-163
7.9
7.9
30.1
8.8
49.7
74.5
119.0
ARG-163
LYS-164
5.9
5.7
-14.9
2.9
66.8
61.5
27.2
LYS-164
PRO-165
2.7
2.4
0.4
2.2
132.1
129.7
-26.3
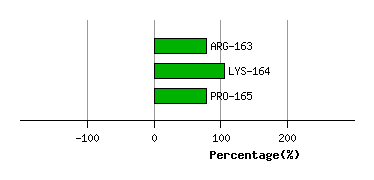
Graph shows rotational transition at bending residues and can be used
to identify hinge bending residues.
Probably only informative for interdomain rotations greater than 20 degrees