Acetaldehyde Dehydrogenase (Acylating)
(All numbering and residues are taken from first PDB file)
![]()
![]()
Bending Residue Dihedral Analysis
Residue
iResidue
i+1Distance of hinge axis to residue i in
(A) Distance of hinge axis to residue i in
(A) Change in
(deg) Change in
(deg) Angle of psi(i) axis to hinge axis
(deg) Angle of psi(i) axis to hinge axis
(deg) Percentage Progress
ASP-77
ALA-78
13.8
13.9
11.4
-10.3
134.6
130.7
40.6
ALA-78
THR-79
13.7
14.0
24.1
-17.7
104.6
101.7
24.0
THR-79
SER-80
17.1
17.5
129.0
-68.2
83.5
80.5
-12.3
SER-80
ALA-81
18.0
18.3
-179.3
5.5
121.0
169.5
-1294.7
ALA-81
SER-82
21.1
17.7
158.6
25.6
27.9
53.2
1438.5
SER-82
ALA-83
20.8
21.0
108.3
-133.7
58.5
88.5
-68.2
ALA-83
HIS-84
21.6
20.8
-53.6
4.7
95.9
119.0
-115.0
HIS-84
VAL-85
18.0
17.5
-1.1
15.4
155.1
163.7
104.5
VAL-85
GLN-86
18.4
18.9
-24.2
-4.0
93.8
97.6
-70.5
GLN-86
ASN-87
21.7
21.6
5.8
-1.0
115.8
108.7
-36.1
ASN-87
GLU-88
20.2
19.7
-1.6
0.6
128.4
133.5
-26.9
GLU-88
ALA-89
17.6
17.2
-4.4
12.3
134.9
135.1
40.6
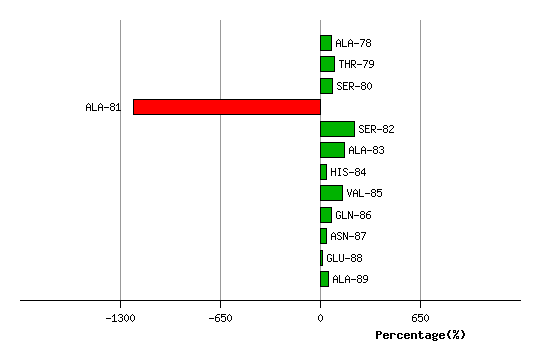
Graph shows rotational transition at bending residues and can be used
to identify hinge bending residues.
Probably only informative for interdomain rotations greater than 20 degrees
Residue
iResidue
i+1Distance of hinge axis to residue i in
(A) Distance of hinge axis to residue i in
(A) Change in
(deg) Change in
(deg) Angle of psi(i) axis to hinge axis
(deg) Angle of psi(i) axis to hinge axis
(deg) Percentage Progress
ILE-101
ASP-102
9.0
9.1
-8.7
13.8
64.8
66.9
-10.9
ASP-102
LEU-103
10.2
10.2
-4.3
-14.2
51.1
44.2
102.8
LEU-103
THR-104
9.7
9.9
8.8
4.9
87.1
91.9
59.1
THR-104
PRO-105
12.5
13.0
36.8
-26.7
143.7
132.3
-92.0
THR-104
PRO-105
12.5
13.0
36.8
-26.7
143.7
132.3
-92.0
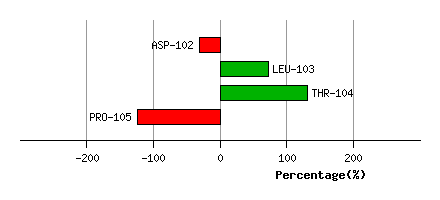
Graph shows rotational transition at bending residues and can be used
to identify hinge bending residues.
Probably only informative for interdomain rotations greater than 20 degrees
Residue
iResidue
i+1Distance of hinge axis to residue i in
(A) Distance of hinge axis to residue i in
(A) Change in
(deg) Change in
(deg) Angle of psi(i) axis to hinge axis
(deg) Angle of psi(i) axis to hinge axis
(deg) Percentage Progress
THR-104
PRO-105
12.5
13.0
36.8
-26.7
143.7
132.3
-92.0
THR-104
PRO-105
12.5
13.0
36.8
-26.7
143.7
132.3
-92.0
PRO-105
ALA-106
12.0
13.5
-116.7
30.9
42.2
26.4
593.0
ALA-106
ALA-107
13.1
14.9
161.2
126.5
108.5
138.8
330.0
ALA-107
ILE-108
15.4
11.8
89.0
18.8
134.1
157.4
-821.8
ILE-108
GLY-109
13.0
12.3
-152.4
-16.0
106.8
69.9
-22.8
GLY-109
PRO-110
9.4
8.6
-0.7
24.3
39.3
102.4
-144.1
PRO-110
TYR-111
6.4
5.8
-0.3
47.5
161.4
161.5
354.7
TYR-111
CYS-112
5.6
5.6
-19.7
-16.3
106.4
104.2
-103.1
CYS-112
VAL-113
2.7
2.7
-9.5
0.8
153.4
156.3
-57.0
VAL-113
PRO-114
4.1
4.1
1.0
3.9
87.0
86.6
-20.1
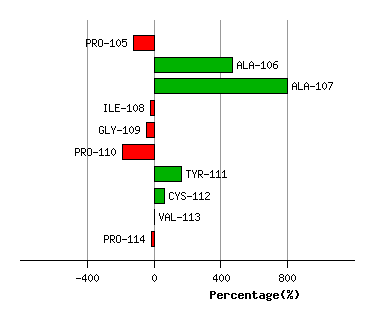
Graph shows rotational transition at bending residues and can be used
to identify hinge bending residues.
Probably only informative for interdomain rotations greater than 20 degrees
Residue
iResidue
i+1Distance of hinge axis to residue i in
(A) Distance of hinge axis to residue i in
(A) Change in
(deg) Change in
(deg) Angle of psi(i) axis to hinge axis
(deg) Angle of psi(i) axis to hinge axis
(deg) Percentage Progress
VAL-116
ASN-117
7.9
8.1
2.6
-11.7
145.7
141.9
51.5
ASN-117
LEU-118
5.5
5.5
9.7
4.0
86.8
82.3
41.8
LEU-118
GLU-119
4.2
4.3
-2.8
-9.3
38.8
38.5
28.4
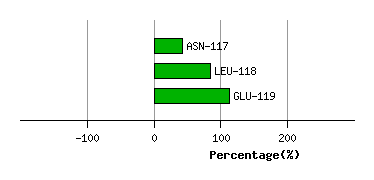
Graph shows rotational transition at bending residues and can be used
to identify hinge bending residues.
Probably only informative for interdomain rotations greater than 20 degrees
Residue
iResidue
i+1Distance of hinge axis to residue i in
(A) Distance of hinge axis to residue i in
(A) Change in
(deg) Change in
(deg) Angle of psi(i) axis to hinge axis
(deg) Angle of psi(i) axis to hinge axis
(deg) Percentage Progress
ASN-126
VAL-127
8.6
9.3
-26.6
16.1
69.2
79.0
-58.7
VAL-127
ASN-128
5.9
6.3
10.5
8.1
128.7
135.5
-91.9
ASN-128
MET-129
7.1
7.4
5.3
-5.6
129.1
131.3
-23.2
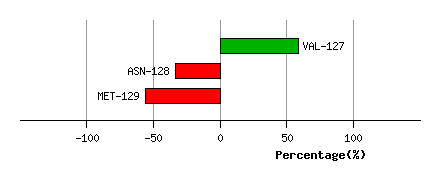
Graph shows rotational transition at bending residues and can be used
to identify hinge bending residues.
Probably only informative for interdomain rotations greater than 20 degrees
Residue
iResidue
i+1Distance of hinge axis to residue i in
(A) Distance of hinge axis to residue i in
(A) Change in
(deg) Change in
(deg) Angle of psi(i) axis to hinge axis
(deg) Angle of psi(i) axis to hinge axis
(deg) Percentage Progress
GLU-278
GLY-279
6.5
6.3
-2.2
-16.0
67.8
67.4
55.7
GLY-279
ALA-280
3.9
3.6
16.3
-7.0
55.1
47.6
55.8
ALA-280
ALA-281
0.7
1.4
4.6
4.0
47.6
50.2
32.9
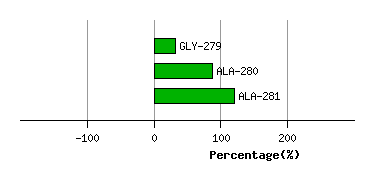
Graph shows rotational transition at bending residues and can be used
to identify hinge bending residues.
Probably only informative for interdomain rotations greater than 20 degrees
Residue
iResidue
i+1Distance of hinge axis to residue i in
(A) Distance of hinge axis to residue i in
(A) Change in
(deg) Change in
(deg) Angle of psi(i) axis to hinge axis
(deg) Angle of psi(i) axis to hinge axis
(deg) Percentage Progress
TYR-287
ALA-288
9.4
9.0
-20.5
5.7
152.9
161.9
-80.6
ALA-288
GLY-289
9.4
9.0
11.0
-9.6
45.3
48.9
5.9
GLY-289
ASN-290
7.4
6.7
16.2
-3.0
21.5
20.2
83.6
ASN-290
LEU-291
9.7
8.9
2.7
19.3
110.3
109.9
-91.2
ASN-290
LEU-291
9.7
8.9
2.7
19.3
110.3
109.9
-91.2
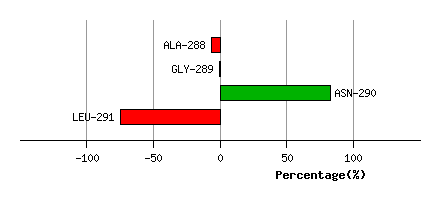
Graph shows rotational transition at bending residues and can be used
to identify hinge bending residues.
Probably only informative for interdomain rotations greater than 20 degrees
Residue
iResidue
i+1Distance of hinge axis to residue i in
(A) Distance of hinge axis to residue i in
(A) Change in
(deg) Change in
(deg) Angle of psi(i) axis to hinge axis
(deg) Angle of psi(i) axis to hinge axis
(deg) Percentage Progress
ASN-290
LEU-291
9.7
8.9
2.7
19.3
110.3
109.9
-91.2
ASN-290
LEU-291
9.7
8.9
2.7
19.3
110.3
109.9
-91.2
LEU-291
ASP-292
8.8
7.7
-14.5
12.7
89.7
69.9
13.6
ASP-292
ILE-293
5.2
3.9
-10.1
2.6
40.7
33.1
33.2
ILE-293
MET-294
4.3
4.5
1.1
-13.5
144.6
147.3
72.5
MET-294
THR-295
5.6
5.4
-6.5
4.7
91.8
91.0
71.3
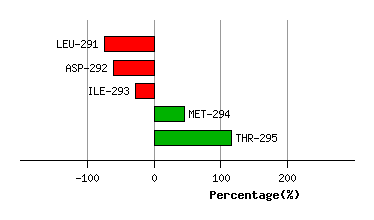
Graph shows rotational transition at bending residues and can be used
to identify hinge bending residues.
Probably only informative for interdomain rotations greater than 20 degrees