Dna-Directed RNA Polymerase Beta' Chain
(All numbering and residues are taken from first PDB file)
![]()
![]()
Bending Residue Dihedral Analysis
Residue
iResidue
i+1Distance of hinge axis to residue i in
(A) Distance of hinge axis to residue i in
(A) Change in
(deg) Change in
(deg) Angle of psi(i) axis to hinge axis
(deg) Angle of psi(i) axis to hinge axis
(deg) Percentage Progress
PRO-109
SER-110
51.2
48.6
0.1
-145.2
40.1
87.3
231.5
SER-110
LYS-111
50.3
50.9
-121.2
-22.2
144.8
157.6
-124.4
LYS-111
ILE-112
53.5
52.9
43.2
-97.4
28.1
46.0
-40.0
ILE-112
GLY-113
51.6
49.5
105.2
71.0
74.0
116.1
55.5
GLY-113
THR-114
48.3
46.8
24.8
6.6
93.9
93.2
-55.0
THR-114
LEU-115
50.4
44.8
97.2
-19.8
27.0
162.4
79.2
LEU-115
LEU-116
52.5
44.1
148.4
-140.0
39.0
100.5
-5.6
LEU-116
ASP-117
49.2
41.2
-16.6
178.7
73.1
138.6
-115.1
ASP-117
LEU-118
46.7
40.9
31.7
-93.8
107.8
80.7
-21.1
LEU-118
SER-119
43.8
44.3
-87.1
-106.3
36.5
52.6
182.6
SER-119
ALA-120
41.7
43.0
-30.1
178.2
26.9
112.7
-68.7
ALA-120
THR-121
44.4
41.0
55.3
52.1
100.7
46.0
-96.3
THR-121
GLU-122
43.1
43.3
110.3
-125.5
85.8
110.7
20.7
GLU-122
LEU-123
39.6
46.3
12.3
-29.0
22.3
110.7
-6.2
LEU-123
GLU-124
40.1
44.3
113.8
59.2
84.2
51.9
140.5
GLU-124
GLN-125
43.4
43.2
140.4
-114.0
117.0
103.1
-8.6
GLN-125
VAL-126
42.0
39.5
43.7
-70.8
59.4
68.2
-18.3
VAL-126
LEU-127
39.2
38.3
-95.6
-88.5
143.8
162.3
-163.3
LEU-127
TYR-128
41.7
39.8
85.8
76.0
96.8
82.7
67.7
TYR-128
PHE-129
42.9
42.9
23.9
147.3
120.2
29.3
90.9
PHE-129
ASN-130
40.9
42.4
82.6
28.4
74.5
64.8
75.7
ASN-130
LYS-131
37.1
45.0
-95.2
-135.6
157.4
163.6
-214.6
LYS-131
TYR-132
36.4
44.5
-115.9
-73.2
118.0
124.3
133.2
TYR-132
ILE-133
36.4
43.3
-30.5
32.7
125.1
104.9
-2.0
ILE-133
VAL-134
38.5
39.6
60.2
-39.6
82.3
34.7
29.4
VAL-134
LEU-135
40.7
36.9
-172.9
-106.9
170.7
73.6
-180.1
LEU-135
ASP-136
40.4
33.7
59.2
-70.8
78.3
137.5
3.9
ASP-136
PRO-137
44.1
31.3
72.3
-106.6
30.3
90.6
191.4
PRO-137
LYS-138
45.0
29.0
-166.8
179.2
131.0
88.1
-157.0
LYS-138
GLY-139
43.2
31.9
-97.5
-133.7
78.5
127.1
146.6
GLY-139
ALA-140
39.9
35.0
151.2
-78.9
38.4
113.0
32.7
ALA-140
VAL-141
37.9
37.7
179.0
-94.6
92.1
116.9
36.8
VAL-141
LEU-142
34.4
40.9
-60.8
84.8
81.5
61.0
-10.7
LEU-142
ASP-143
31.7
43.7
-72.5
-50.1
52.0
6.6
-211.0
ASP-143
GLY-144
29.5
42.5
-73.9
-170.0
75.9
72.0
108.6
GLY-144
VAL-145
27.8
38.7
155.6
47.0
69.1
104.6
85.5
VAL-145
PRO-146
31.3
38.4
-75.1
-5.4
104.9
100.9
-20.0
PRO-146
VAL-147
34.3
35.7
-14.1
-31.2
44.6
45.8
14.7
VAL-147
GLU-148
36.5
33.9
37.5
22.5
142.9
75.0
-17.3
GLU-148
LYS-149
38.0
34.3
-3.0
-151.4
84.5
142.9
-161.1
LYS-149
ARG-150
41.5
31.8
81.2
26.5
154.7
40.3
0.9
ARG-150
GLN-151
43.2
32.3
-108.6
87.7
44.9
126.5
21.6
GLN-151
LEU-152
39.9
35.5
142.0
-6.6
94.9
60.1
40.8
LEU-152
LEU-153
37.3
34.1
163.6
106.0
52.0
49.2
-54.0
LEU-153
THR-154
34.7
31.0
140.1
-10.2
120.1
29.6
103.4
THR-154
ASP-155
32.3
32.9
-159.3
-24.4
109.5
110.4
-84.4
GLU-156
GLU-157
29.5
29.5
129.1
-73.9
41.9
82.5
21.6
GLU-157
TYR-158
30.3
31.0
-149.8
-57.7
130.4
138.9
159.7
TYR-158
ARG-159
33.4
31.9
-148.8
-121.8
129.9
69.8
24.4
ARG-159
GLU-160
31.6
32.5
-158.0
-58.1
133.0
149.9
-158.2
GLU-160
LEU-161
28.8
32.9
42.5
88.3
54.3
95.2
27.1
LEU-161
ARG-162
31.6
31.9
-164.4
-1.3
129.5
151.6
193.4
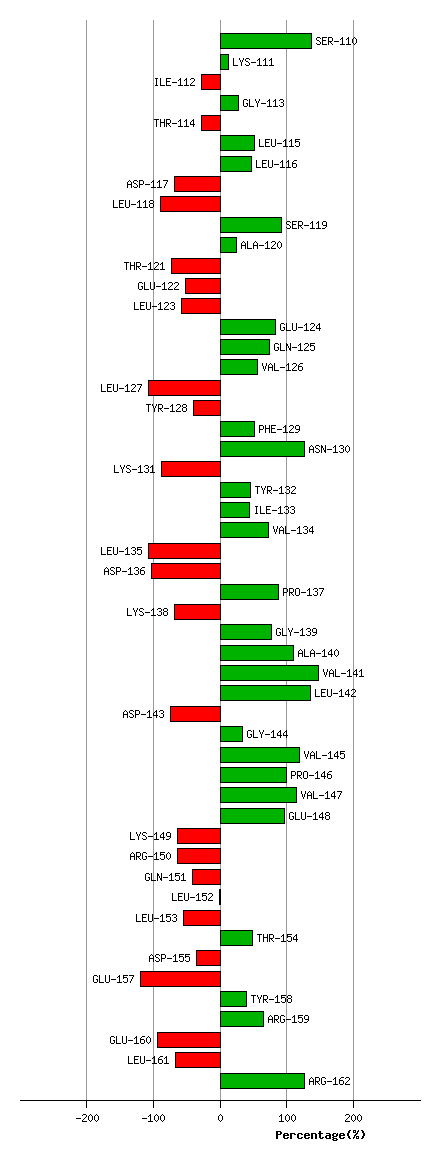
Graph shows rotational transition at bending residues and can be used
to identify hinge bending residues.
Probably only informative for interdomain rotations greater than 20 degrees
Residue
iResidue
i+1Distance of hinge axis to residue i in
(A) Distance of hinge axis to residue i in
(A) Change in
(deg) Change in
(deg) Angle of psi(i) axis to hinge axis
(deg) Angle of psi(i) axis to hinge axis
(deg) Percentage Progress
VAL-440
ARG-441
26.6
30.6
-27.2
175.5
83.1
87.0
118.1
ARG-441
ASN-442
23.3
31.3
177.2
147.4
141.3
65.3
13.6
ASN-442
VAL-443
24.3
28.9
-140.9
-142.8
103.5
95.0
95.8
VAL-443
VAL-444
24.1
29.5
-91.2
36.7
109.3
112.5
24.9
VAL-444
ARG-445
26.7
26.5
43.6
-14.0
44.3
62.6
37.6
ARG-445
VAL-446
25.8
25.4
-80.6
76.6
117.0
153.3
2.7
VAL-446
VAL-447
27.6
24.8
58.7
-52.4
22.9
70.0
9.0
VAL-447
GLU-448
27.4
23.3
164.2
139.7
70.8
16.1
-57.4
GLU-448
SER-449
27.6
23.3
103.3
-40.3
45.5
52.6
34.0
SER-449
TYR-450
31.1
22.6
-12.4
-16.3
70.3
153.3
-14.6
TYR-450
ASP-451
34.0
25.0
64.5
19.2
67.4
42.9
-143.2
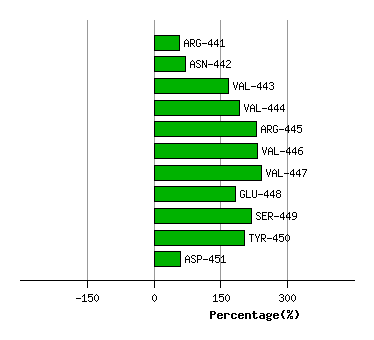
Graph shows rotational transition at bending residues and can be used
to identify hinge bending residues.
Probably only informative for interdomain rotations greater than 20 degrees