Cytochrome P450cam
(All numbering and residues are taken from first PDB file)
![]()
![]()
Bending Residue Dihedral Analysis
Residue
iResidue
i+1Distance of hinge axis to residue i in
(A) Distance of hinge axis to residue i in
(A) Change in
(deg) Change in
(deg) Angle of psi(i) axis to hinge axis
(deg) Angle of psi(i) axis to hinge axis
(deg) Percentage Progress
PRO-86
PHE-87
17.4
17.8
-7.4
-18.5
133.4
139.7
-111.6
PHE-87
ILE-88
19.3
19.1
27.2
0.1
94.5
87.5
-27.0
ILE-88
PRO-89
22.8
22.6
21.2
9.1
48.7
66.7
-0.4
PRO-89
ARG-90
24.9
25.0
3.5
-3.6
123.0
161.6
-4.6
ARG-90
GLU-91
23.3
25.1
-3.4
12.5
102.5
62.8
-29.6
GLU-91
ALA-92
24.6
24.9
-33.0
3.1
142.7
99.4
-110.4
ALA-92
GLY-93
22.4
21.7
-30.6
59.1
76.2
60.7
-101.2
GLY-93
GLU-94
19.5
20.3
-50.4
-102.4
48.4
13.9
793.8
GLU-94
ALA-95
21.7
21.1
83.6
10.5
143.6
101.3
-318.5
ALA-95
TYR-96
19.7
19.7
-51.7
-0.7
96.8
103.9
-64.7
TYR-96
ASP-97
16.3
16.5
-29.4
18.9
30.3
42.3
45.7
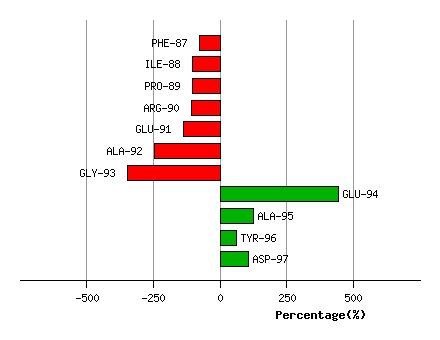
Graph shows rotational transition at bending residues and can be used
to identify hinge bending residues.
Probably only informative for interdomain rotations greater than 20 degrees
Residue
iResidue
i+1Distance of hinge axis to residue i in
(A) Distance of hinge axis to residue i in
(A) Change in
(deg) Change in
(deg) Angle of psi(i) axis to hinge axis
(deg) Angle of psi(i) axis to hinge axis
(deg) Percentage Progress
PHE-98
ILE-99
10.3
10.7
-3.4
0.0
116.9
111.7
15.6
ILE-99
PRO-100
7.2
7.4
-5.3
5.3
46.4
45.2
54.8
PRO-100
THR-101
6.9
7.0
-20.1
-12.4
68.7
68.5
64.4
THR-101
SER-102
10.1
10.1
17.0
4.0
53.2
55.6
41.6
SER-102
MET-103
12.5
12.5
1.5
-14.3
43.7
39.0
-63.5
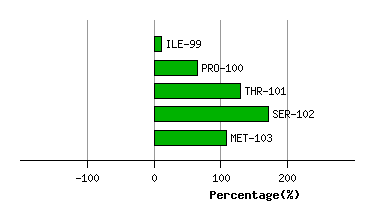
Graph shows rotational transition at bending residues and can be used
to identify hinge bending residues.
Probably only informative for interdomain rotations greater than 20 degrees
Residue
iResidue
i+1Distance of hinge axis to residue i in
(A) Distance of hinge axis to residue i in
(A) Change in
(deg) Change in
(deg) Angle of psi(i) axis to hinge axis
(deg) Angle of psi(i) axis to hinge axis
(deg) Percentage Progress
GLN-110
PHE-111
4.9
5.4
12.6
-10.4
47.1
55.5
7.4
PHE-111
ARG-112
2.5
3.0
10.1
0.0
23.4
20.1
50.8
ARG-112
ALA-113
4.5
4.4
8.1
2.7
85.5
85.0
17.5
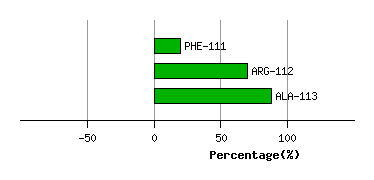
Graph shows rotational transition at bending residues and can be used
to identify hinge bending residues.
Probably only informative for interdomain rotations greater than 20 degrees
Residue
iResidue
i+1Distance of hinge axis to residue i in
(A) Distance of hinge axis to residue i in
(A) Change in
(deg) Change in
(deg) Angle of psi(i) axis to hinge axis
(deg) Angle of psi(i) axis to hinge axis
(deg) Percentage Progress
GLN-117
VAL-118
7.4
6.3
11.0
-3.5
129.4
121.7
-34.4
VAL-118
VAL-119
6.5
5.6
-1.1
-10.2
14.7
12.1
69.6
VAL-119
GLY-120
4.9
4.0
12.2
-14.3
108.1
107.4
11.6
GLY-120
MET-121
7.3
5.9
3.8
1.0
140.6
135.9
-33.4
MET-121
PRO-122
10.0
8.7
0.5
3.0
90.1
84.0
-2.1
PRO-122
VAL-123
12.5
11.1
-3.9
2.1
75.8
71.7
2.1
VAL-123
VAL-124
10.4
9.4
1.3
0.5
165.9
173.2
-10.9
VAL-124
ASP-125
9.0
8.3
4.9
-2.0
126.4
117.1
-13.2
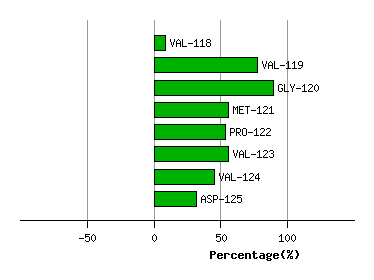
Graph shows rotational transition at bending residues and can be used
to identify hinge bending residues.
Probably only informative for interdomain rotations greater than 20 degrees
Residue
iResidue
i+1Distance of hinge axis to residue i in
(A) Distance of hinge axis to residue i in
(A) Change in
(deg) Change in
(deg) Angle of psi(i) axis to hinge axis
(deg) Angle of psi(i) axis to hinge axis
(deg) Percentage Progress
ARG-130
ILE-131
13.7
13.5
-0.8
4.2
67.5
57.2
-0.3
ILE-131
GLN-132
10.0
9.9
-14.5
8.4
3.0
13.5
33.7
GLN-132
GLU-133
10.8
11.2
-10.3
6.7
67.7
64.9
34.6
GLU-133
LEU-134
13.7
14.0
-6.7
0.1
86.3
76.8
26.6
LEU-134
ALA-135
12.1
12.5
-1.5
5.5
39.8
39.2
-20.6
ALA-135
CYS-136
9.3
9.5
1.0
-2.7
150.6
150.6
9.8
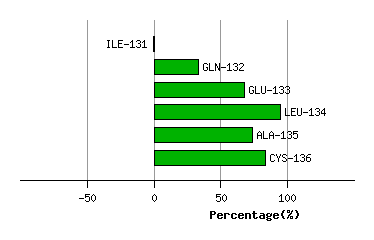
Graph shows rotational transition at bending residues and can be used
to identify hinge bending residues.
Probably only informative for interdomain rotations greater than 20 degrees
Residue
iResidue
i+1Distance of hinge axis to residue i in
(A) Distance of hinge axis to residue i in
(A) Change in
(deg) Change in
(deg) Angle of psi(i) axis to hinge axis
(deg) Angle of psi(i) axis to hinge axis
(deg) Percentage Progress
GLU-156
PRO-157
11.1
11.1
-13.4
6.6
69.6
71.0
35.4
PRO-157
PHE-158
12.0
12.3
-0.6
-6.1
70.6
79.4
6.7
PHE-158
PRO-159
8.7
9.2
-3.4
-2.7
16.7
24.5
41.4
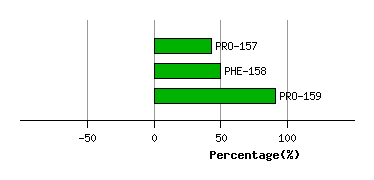
Graph shows rotational transition at bending residues and can be used
to identify hinge bending residues.
Probably only informative for interdomain rotations greater than 20 degrees
Residue
iResidue
i+1Distance of hinge axis to residue i in
(A) Distance of hinge axis to residue i in
(A) Change in
(deg) Change in
(deg) Angle of psi(i) axis to hinge axis
(deg) Angle of psi(i) axis to hinge axis
(deg) Percentage Progress
LEU-250
ASP-251
8.2
9.9
59.7
-77.2
130.0
122.3
58.9
ASP-251
THR-252
10.2
10.3
82.3
-74.8
110.9
99.9
15.4
THR-252
VAL-253
8.2
7.7
-22.3
5.9
40.0
30.2
69.7
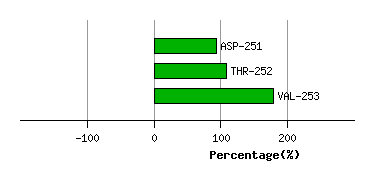
Graph shows rotational transition at bending residues and can be used
to identify hinge bending residues.
Probably only informative for interdomain rotations greater than 20 degrees