Catabolite Gene Activator
(All numbering and residues are taken from first PDB file)
![]()
![]()
Bending Residue Dihedral Analysis
Residue
iResidue
i+1Distance of hinge axis to residue i in
(A) Distance of hinge axis to residue i in
(A) Change in
(deg) Change in
(deg) Angle of psi(i) axis to hinge axis
(deg) Angle of psi(i) axis to hinge axis
(deg) Percentage Progress
VAL-47
ALA-48
8.7
9.2
-18.9
-4.5
35.9
31.9
79.0
ALA-48
VAL-49
8.2
8.6
40.1
-34.9
115.1
120.0
8.0
VAL-49
LEU-50
10.6
10.5
2.5
-16.4
175.5
164.8
51.8
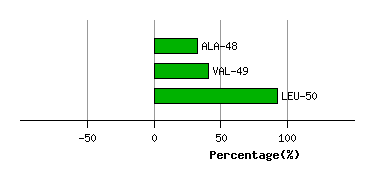
Graph shows rotational transition at bending residues and can be used
to identify hinge bending residues.
Probably only informative for interdomain rotations greater than 20 degrees
Residue
iResidue
i+1Distance of hinge axis to residue i in
(A) Distance of hinge axis to residue i in
(A) Change in
(deg) Change in
(deg) Angle of psi(i) axis to hinge axis
(deg) Angle of psi(i) axis to hinge axis
(deg) Percentage Progress
ILE-60
LEU-61
8.1
6.9
-0.3
37.3
99.7
83.2
6.1
LEU-61
SER-62
8.6
8.4
-22.6
-16.7
29.5
39.6
119.8
SER-62
TYR-63
8.2
6.9
-12.5
55.3
50.3
50.4
-86.2
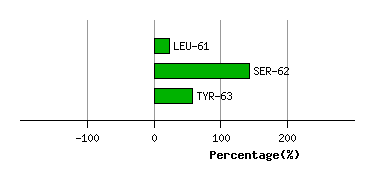
Graph shows rotational transition at bending residues and can be used
to identify hinge bending residues.
Probably only informative for interdomain rotations greater than 20 degrees
Residue
iResidue
i+1Distance of hinge axis to residue i in
(A) Distance of hinge axis to residue i in
(A) Change in
(deg) Change in
(deg) Angle of psi(i) axis to hinge axis
(deg) Angle of psi(i) axis to hinge axis
(deg) Percentage Progress
VAL-139
THR-140
6.5
6.3
-20.8
8.1
97.8
129.7
-34.4
THR-140
GLY-141
10.3
9.3
-134.3
-141.9
148.1
131.0
259.5
GLY-141
ARG-142
11.3
10.3
-73.6
49.6
122.4
132.5
-44.6
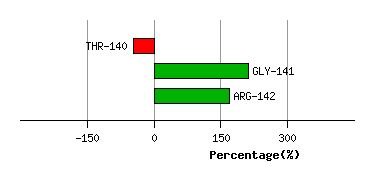
Graph shows rotational transition at bending residues and can be used
to identify hinge bending residues.
Probably only informative for interdomain rotations greater than 20 degrees
Residue
iResidue
i+1Distance of hinge axis to residue i in
(A) Distance of hinge axis to residue i in
(A) Change in
(deg) Change in
(deg) Angle of psi(i) axis to hinge axis
(deg) Angle of psi(i) axis to hinge axis
(deg) Percentage Progress
VAL-176
GLY-177
2.5
1.8
13.3
-25.4
32.7
25.2
-26.8
GLY-177
CYS-178
2.3
2.6
43.6
-18.3
48.3
43.3
84.5
CYS-178
SER-179
1.4
1.3
22.4
-17.1
117.7
96.6
6.2
SER-179
ARG-180
5.1
5.0
26.6
-30.9
103.6
122.9
-38.5
ARG-180
GLU-181
7.0
7.8
-65.1
38.3
42.5
69.5
36.0
ARG-180
GLU-181
7.0
7.8
-65.1
38.3
42.5
69.5
36.0
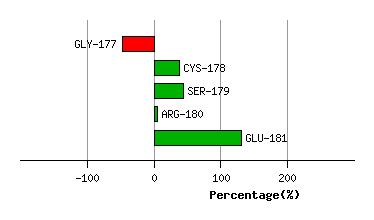
Graph shows rotational transition at bending residues and can be used
to identify hinge bending residues.
Probably only informative for interdomain rotations greater than 20 degrees
Residue
iResidue
i+1Distance of hinge axis to residue i in
(A) Distance of hinge axis to residue i in
(A) Change in
(deg) Change in
(deg) Angle of psi(i) axis to hinge axis
(deg) Angle of psi(i) axis to hinge axis
(deg) Percentage Progress
ARG-180
GLU-181
7.0
7.8
-65.1
38.3
42.5
69.5
36.0
ARG-180
GLU-181
7.0
7.8
-65.1
38.3
42.5
69.5
36.0
GLU-181
THR-182
8.0
9.3
10.7
14.5
108.2
88.3
-17.2
THR-182
VAL-183
6.6
7.1
4.3
11.3
26.5
23.9
69.8
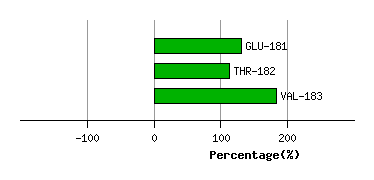
Graph shows rotational transition at bending residues and can be used
to identify hinge bending residues.
Probably only informative for interdomain rotations greater than 20 degrees