(All numbering and residues are taken from first PDB file)
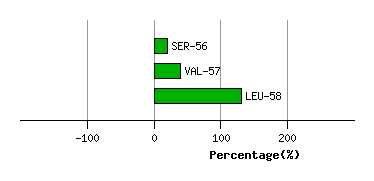
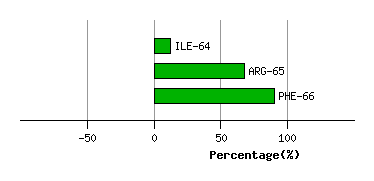
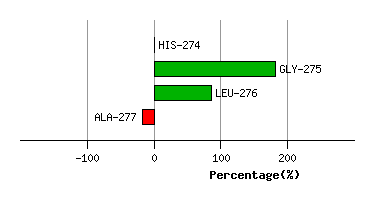
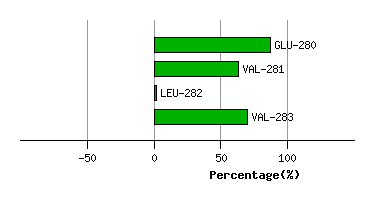
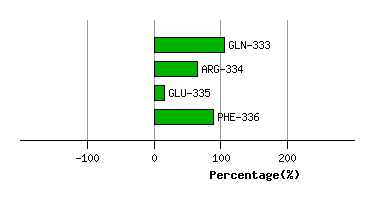
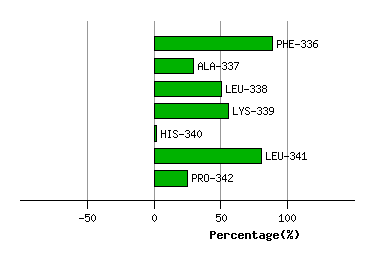
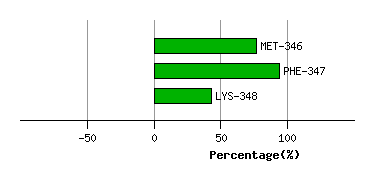
Bending Residue Dihedral Analysis
Residue i
Residue i+1
Distance of hinge axis to residue i in conformer 1 (A)
Distance of hinge axis to residue i in conformer 2 (A)
Change in psi (i) (deg)
Change in phi (i+1) (deg)
Angle of psi(i) axis to hinge axis conformer 1 (deg)
Angle of psi(i) axis to hinge axis conformer 2 (deg)
Percentage Progress
THR-55
SER-56
5.7
6.2
-16.4
5.0
60.1
67.5
20.4
SER-56
VAL-57
2.5
2.8
24.6
-18.6
66.3
63.6
20.0
VAL-57
LEU-58
2.5
2.6
3.7
-31.2
127.0
128.3
91.0
Graph shows rotational transition at bending residues and can be used
to identify hinge bending residues.
Probably only informative for interdomain rotations greater than 20 degrees
Residue i
Residue i+1
Distance of hinge axis to residue i in conformer 1 (A)
Distance of hinge axis to residue i in conformer 2 (A)
Change in psi (i) (deg)
Change in phi (i+1) (deg)
Angle of psi(i) axis to hinge axis conformer 1 (deg)
Angle of psi(i) axis to hinge axis conformer 2 (deg)
Percentage Progress
GLY-63
ILE-64
7.3
6.9
-25.7
26.7
60.6
59.2
67.2
ILE-64
ARG-65
3.6
3.2
-2.9
-13.1
75.2
67.9
55.5
ARG-65
PHE-66
3.0
2.6
-5.7
-1.1
82.6
83.2
22.5
Graph shows rotational transition at bending residues and can be used
to identify hinge bending residues.
Probably only informative for interdomain rotations greater than 20 degrees
Residue i
Residue i+1
Distance of hinge axis to residue i in conformer 1 (A)
Distance of hinge axis to residue i in conformer 2 (A)
Change in psi (i) (deg)
Change in phi (i+1) (deg)
Angle of psi(i) axis to hinge axis conformer 1 (deg)
Angle of psi(i) axis to hinge axis conformer 2 (deg)
Percentage Progress
LEU-273
HIS-274
18.2
17.4
-7.2
15.6
107.6
115.1
32.1
HIS-274
GLY-275
15.1
14.4
-75.8
21.6
43.7
42.3
182.2
GLY-275
LEU-276
13.6
12.3
6.1
24.1
139.9
164.1
-96.2
LEU-276
ALA-277
14.1
14.3
-57.5
76.0
83.1
68.4
-103.3
Graph shows rotational transition at bending residues and can be used
to identify hinge bending residues.
Probably only informative for interdomain rotations greater than 20 degrees
Residue i
Residue i+1
Distance of hinge axis to residue i in conformer 1 (A)
Distance of hinge axis to residue i in conformer 2 (A)
Change in psi (i) (deg)
Change in phi (i+1) (deg)
Angle of psi(i) axis to hinge axis conformer 1 (deg)
Angle of psi(i) axis to hinge axis conformer 2 (deg)
Percentage Progress
GLN-279
GLU-280
11.3
12.1
6.3
-5.6
85.5
73.3
57.6
GLU-280
VAL-281
14.0
14.7
-1.1
10.3
111.0
108.9
-24.0
VAL-281
LEU-282
12.3
12.6
-12.2
0.2
157.4
166.9
-60.9
LEU-282
VAL-283
10.3
11.1
-2.9
7.7
134.2
125.6
67.9
Graph shows rotational transition at bending residues and can be used
to identify hinge bending residues.
Probably only informative for interdomain rotations greater than 20 degrees
Residue i
Residue i+1
Distance of hinge axis to residue i in conformer 1 (A)
Distance of hinge axis to residue i in conformer 2 (A)
Change in psi (i) (deg)
Change in phi (i+1) (deg)
Angle of psi(i) axis to hinge axis conformer 1 (deg)
Angle of psi(i) axis to hinge axis conformer 2 (deg)
Percentage Progress
CYS-332
GLN-333
7.2
6.8
1.1
16.5
17.1
19.8
43.5
GLN-333
ARG-334
5.6
5.1
-21.9
13.4
128.7
131.9
-40.0
ARG-334
GLU-335
8.9
8.5
6.3
-13.5
80.6
78.6
-49.1
GLU-335
PHE-336
10.9
10.1
0.3
-4.7
132.5
127.1
4.7
GLU-335
PHE-336
10.9
10.1
0.3
-4.7
132.5
127.1
4.7
Graph shows rotational transition at bending residues and can be used
to identify hinge bending residues.
Probably only informative for interdomain rotations greater than 20 degrees
Residue i
Residue i+1
Distance of hinge axis to residue i in conformer 1 (A)
Distance of hinge axis to residue i in conformer 2 (A)
Change in psi (i) (deg)
Change in phi (i+1) (deg)
Angle of psi(i) axis to hinge axis conformer 1 (deg)
Angle of psi(i) axis to hinge axis conformer 2 (deg)
Percentage Progress
GLU-335
PHE-336
10.9
10.1
0.3
-4.7
132.5
127.1
4.7
GLU-335
PHE-336
10.9
10.1
0.3
-4.7
132.5
127.1
4.7
PHE-336
ALA-337
8.8
7.9
15.3
-7.5
157.5
160.7
-59.3
ALA-337
LEU-338
8.4
7.7
-5.7
0.8
69.2
71.6
20.9
LEU-338
LYS-339
12.2
11.5
5.5
0.1
113.6
106.9
5.2
LYS-339
HIS-340
12.8
12.1
0.3
8.5
149.5
146.6
-53.5
HIS-340
LEU-341
10.5
9.6
8.8
-23.4
137.8
141.3
78.3
LEU-341
PRO-342
8.7
8.0
-6.7
4.6
89.2
87.9
5.4
LEU-341
PRO-342
8.7
8.0
-6.7
4.6
89.2
87.9
5.4
Graph shows rotational transition at bending residues and can be used
to identify hinge bending residues.
Probably only informative for interdomain rotations greater than 20 degrees
Residue i
Residue i+1
Distance of hinge axis to residue i in conformer 1 (A)
Distance of hinge axis to residue i in conformer 2 (A)
Change in psi (i) (deg)
Change in phi (i+1) (deg)
Angle of psi(i) axis to hinge axis conformer 1 (deg)
Angle of psi(i) axis to hinge axis conformer 2 (deg)
Percentage Progress
LEU-341
PRO-342
8.7
8.0
-6.7
4.6
89.2
87.9
5.4
LEU-341
PRO-342
8.7
8.0
-6.7
4.6
89.2
87.9
5.4
PRO-342
HIS-343
11.9
11.0
10.3
6.1
45.6
43.4
68.8
HIS-343
ASP-344
11.9
11.0
-35.9
25.1
108.9
106.4
-13.2
Graph shows rotational transition at bending residues and can be used
to identify hinge bending residues.
Probably only informative for interdomain rotations greater than 20 degrees
Residue i
Residue i+1
Distance of hinge axis to residue i in conformer 1 (A)
Distance of hinge axis to residue i in conformer 2 (A)
Change in psi (i) (deg)
Change in phi (i+1) (deg)
Angle of psi(i) axis to hinge axis conformer 1 (deg)
Angle of psi(i) axis to hinge axis conformer 2 (deg)
Percentage Progress
PRO-345
MET-346
9.9
9.8
10.4
14.1
36.1
45.5
44.4
MET-346
PHE-347
8.8
8.7
-7.4
4.4
159.4
151.2
17.3
PHE-347
LYS-348
8.7
8.6
-8.3
-1.9
88.4
92.5
-51.5
Graph shows rotational transition at bending residues and can be used
to identify hinge bending residues.
Probably only informative for interdomain rotations greater than 20 degrees
Residue i
Residue i+1
Distance of hinge axis to residue i in conformer 1 (A)
Distance of hinge axis to residue i in conformer 2 (A)
Change in psi (i) (deg)
Change in phi (i+1) (deg)
Angle of psi(i) axis to hinge axis conformer 1 (deg)
Angle of psi(i) axis to hinge axis conformer 2 (deg)
Percentage Progress
ASN-373
VAL-374
9.3
9.8
-36.8
46.0
106.8
130.4
-40.5
VAL-374
ASP-375
5.7
6.3
-8.6
8.1
153.6
151.8
-26.5
ASP-375
ALA-376
7.3
8.2
5.7
-10.9
30.9
39.7
-2.3
Graph shows rotational transition at bending residues and can be used
to identify hinge bending residues.
Probably only informative for interdomain rotations greater than 20 degrees
Residue i
Residue i+1
Distance of hinge axis to residue i in conformer 1 (A)
Distance of hinge axis to residue i in conformer 2 (A)
Change in psi (i) (deg)
Change in phi (i+1) (deg)
Angle of psi(i) axis to hinge axis conformer 1 (deg)
Angle of psi(i) axis to hinge axis conformer 2 (deg)
Percentage Progress
HIS-377
SER-378
6.2
6.4
43.9
-28.0
118.3
107.3
4.2
SER-378
GLY-379
3.0
3.8
2.2
-2.4
154.7
158.1
-24.8
GLY-379
VAL-380
4.8
5.2
-6.3
14.1
33.5
41.5
-14.9
VAL-380
LEU-381
4.4
4.6
-7.2
14.8
79.7
81.5
-10.5
Graph shows rotational transition at bending residues and can be used
to identify hinge bending residues.
Probably only informative for interdomain rotations greater than 20 degrees