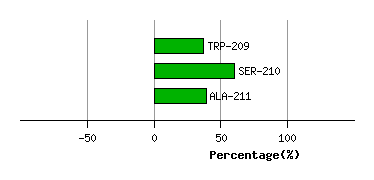
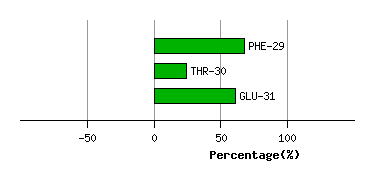
(All numbering and residues are taken from first PDB file)
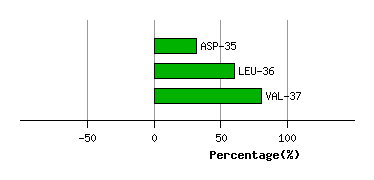
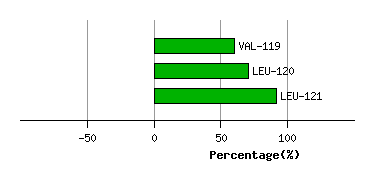
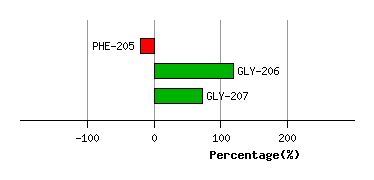
Bending Residue Dihedral Analysis
Residue i
Residue i+1
Distance of hinge axis to residue i in conformer 1 (A)
Distance of hinge axis to residue i in conformer 2 (A)
Change in psi (i) (deg)
Change in phi (i+1) (deg)
Angle of psi(i) axis to hinge axis conformer 1 (deg)
Angle of psi(i) axis to hinge axis conformer 2 (deg)
Percentage Progress
CYS-28
PHE-29
5.5
5.4
-11.8
2.6
50.1
46.8
29.1
PHE-29
THR-30
3.5
3.8
5.5
-2.4
140.9
142.5
-43.9
THR-30
GLU-31
4.4
4.8
11.9
-18.6
143.8
137.1
37.2
Graph shows rotational transition at bending residues and can be used
to identify hinge bending residues.
Probably only informative for interdomain rotations greater than 20 degrees
Residue i
Residue i+1
Distance of hinge axis to residue i in conformer 1 (A)
Distance of hinge axis to residue i in conformer 2 (A)
Change in psi (i) (deg)
Change in phi (i+1) (deg)
Angle of psi(i) axis to hinge axis conformer 1 (deg)
Angle of psi(i) axis to hinge axis conformer 2 (deg)
Percentage Progress
GLU-34
ASP-35
10.4
10.9
-9.3
4.8
82.4
73.9
2.9
ASP-35
LEU-36
9.6
10.0
-2.3
1.2
26.2
25.4
28.8
LEU-36
VAL-37
8.9
9.0
2.7
-2.0
104.6
104.7
20.0
Graph shows rotational transition at bending residues and can be used
to identify hinge bending residues.
Probably only informative for interdomain rotations greater than 20 degrees
Residue i
Residue i+1
Distance of hinge axis to residue i in conformer 1 (A)
Distance of hinge axis to residue i in conformer 2 (A)
Change in psi (i) (deg)
Change in phi (i+1) (deg)
Angle of psi(i) axis to hinge axis conformer 1 (deg)
Angle of psi(i) axis to hinge axis conformer 2 (deg)
Percentage Progress
VAL-118
VAL-119
2.8
3.4
0.4
-7.3
165.1
162.8
50.0
VAL-119
LEU-120
2.7
3.0
11.1
-11.9
101.7
100.0
10.0
LEU-120
LEU-121
1.3
1.1
2.1
-5.3
168.1
164.4
21.6
Graph shows rotational transition at bending residues and can be used
to identify hinge bending residues.
Probably only informative for interdomain rotations greater than 20 degrees
Residue i
Residue i+1
Distance of hinge axis to residue i in conformer 1 (A)
Distance of hinge axis to residue i in conformer 2 (A)
Change in psi (i) (deg)
Change in phi (i+1) (deg)
Angle of psi(i) axis to hinge axis conformer 1 (deg)
Angle of psi(i) axis to hinge axis conformer 2 (deg)
Percentage Progress
SER-204
PHE-205
13.1
14.2
-66.3
4.9
93.3
84.3
81.4
PHE-205
GLY-206
9.4
10.5
59.9
-88.8
116.5
125.1
139.3
GLY-206
GLY-207
7.3
8.0
-2.3
-10.0
121.9
97.4
-46.8
Graph shows rotational transition at bending residues and can be used
to identify hinge bending residues.
Probably only informative for interdomain rotations greater than 20 degrees
Residue i
Residue i+1
Distance of hinge axis to residue i in conformer 1 (A)
Distance of hinge axis to residue i in conformer 2 (A)
Change in psi (i) (deg)
Change in phi (i+1) (deg)
Angle of psi(i) axis to hinge axis conformer 1 (deg)
Angle of psi(i) axis to hinge axis conformer 2 (deg)
Percentage Progress
PHE-208
TRP-209
5.6
5.0
-5.3
3.1
16.2
23.2
-9.0
TRP-209
SER-210
7.6
7.4
1.1
-14.3
116.8
118.3
23.2
SER-210
ALA-211
6.4
6.4
-7.5
12.1
88.9
81.5
-21.3
Graph shows rotational transition at bending residues and can be used
to identify hinge bending residues.
Probably only informative for interdomain rotations greater than 20 degrees