Camp-Dependent Protein Kinase, Alpha-Catalytic Subunit
(All numbering and residues are taken from first PDB file)
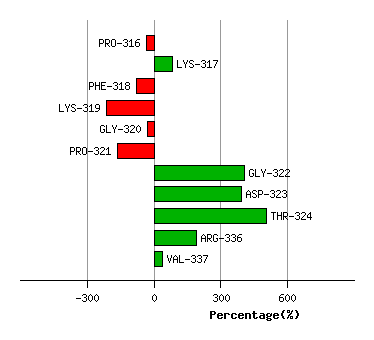
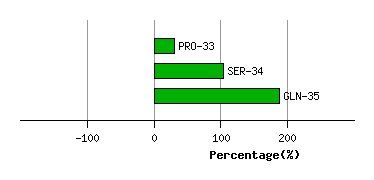
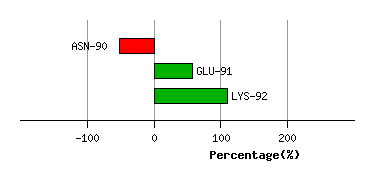
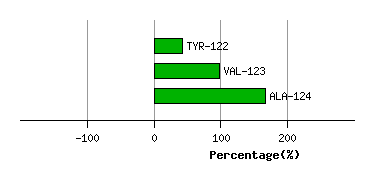
Bending Residue Dihedral Analysis
Residue i
Residue i+1
Distance of hinge axis to residue i in conformer 1 (A)
Distance of hinge axis to residue i in conformer 2 (A)
Change in psi (i) (deg)
Change in phi (i+1) (deg)
Angle of psi(i) axis to hinge axis conformer 1 (deg)
Angle of psi(i) axis to hinge axis conformer 2 (deg)
Percentage Progress
THR-32
PRO-33
11.5
10.1
13.3
-40.6
147.5
144.4
96.0
PRO-33
SER-34
8.5
7.3
-32.1
25.8
70.1
80.0
73.5
SER-34
GLN-35
8.9
8.6
9.2
13.2
80.9
82.0
84.8
Graph shows rotational transition at bending residues and can be used
to identify hinge bending residues.
Probably only informative for interdomain rotations greater than 20 degrees
Residue i
Residue i+1
Distance of hinge axis to residue i in conformer 1 (A)
Distance of hinge axis to residue i in conformer 2 (A)
Change in psi (i) (deg)
Change in phi (i+1) (deg)
Angle of psi(i) axis to hinge axis conformer 1 (deg)
Angle of psi(i) axis to hinge axis conformer 2 (deg)
Percentage Progress
LEU-89
ASN-90
2.5
3.1
9.5
-16.1
72.8
66.8
-60.5
ASN-90
GLU-91
4.4
4.9
14.8
5.0
7.7
7.9
108.8
GLU-91
LYS-92
5.0
5.3
-4.7
10.4
116.9
114.3
52.8
Graph shows rotational transition at bending residues and can be used
to identify hinge bending residues.
Probably only informative for interdomain rotations greater than 20 degrees
Residue i
Residue i+1
Distance of hinge axis to residue i in conformer 1 (A)
Distance of hinge axis to residue i in conformer 2 (A)
Change in psi (i) (deg)
Change in phi (i+1) (deg)
Angle of psi(i) axis to hinge axis conformer 1 (deg)
Angle of psi(i) axis to hinge axis conformer 2 (deg)
Percentage Progress
VAL-104
LYS-105
5.8
6.1
-9.9
15.3
115.5
115.7
7.8
LYS-105
LEU-106
3.8
3.6
-2.3
0.4
117.9
119.3
-37.8
LEU-106
GLU-107
1.7
1.3
37.6
-41.5
101.7
102.2
11.6
Graph shows rotational transition at bending residues and can be used
to identify hinge bending residues.
Probably only informative for interdomain rotations greater than 20 degrees
Residue i
Residue i+1
Distance of hinge axis to residue i in conformer 1 (A)
Distance of hinge axis to residue i in conformer 2 (A)
Change in psi (i) (deg)
Change in phi (i+1) (deg)
Angle of psi(i) axis to hinge axis conformer 1 (deg)
Angle of psi(i) axis to hinge axis conformer 2 (deg)
Percentage Progress
GLU-121
TYR-122
0.8
1.4
23.5
-15.9
67.3
69.3
39.9
TYR-122
VAL-123
3.8
4.4
-24.7
37.5
130.4
129.9
54.5
VAL-123
ALA-124
6.0
6.5
-22.9
26.3
113.0
119.4
69.4
Graph shows rotational transition at bending residues and can be used
to identify hinge bending residues.
Probably only informative for interdomain rotations greater than 20 degrees
Residue i
Residue i+1
Distance of hinge axis to residue i in conformer 1 (A)
Distance of hinge axis to residue i in conformer 2 (A)
Change in psi (i) (deg)
Change in phi (i+1) (deg)
Angle of psi(i) axis to hinge axis conformer 1 (deg)
Angle of psi(i) axis to hinge axis conformer 2 (deg)
Percentage Progress
ILE-315
PRO-316
12.7
13.8
46.9
-65.3
93.6
87.5
-30.9
PRO-316
LYS-317
12.5
12.6
9.0
-46.6
121.9
126.3
116.3
LYS-317
PHE-318
11.3
11.3
-16.8
-38.5
119.2
116.2
-162.1
PHE-318
LYS-319
8.0
8.9
53.7
7.9
77.3
136.5
-132.3
LYS-319
GLY-320
10.4
9.9
-150.5
-107.4
123.7
92.9
183.0
GLY-320
PRO-321
9.5
7.6
-53.3
32.5
149.0
163.0
-133.9
PRO-321
GLY-322
11.8
6.4
44.3
154.4
91.7
50.0
570.3
GLY-322
ASP-323
14.6
8.4
-83.8
13.3
150.9
66.8
-12.8
ASP-323
THR-324
17.4
10.6
-63.1
69.6
96.9
133.3
110.2
ILE-335
ARG-336
19.2
18.8
35.6
61.9
53.5
43.3
492.8
ARG-336
VAL-337
21.7
20.7
60.4
-85.5
30.4
58.4
-151.0
Graph shows rotational transition at bending residues and can be used
to identify hinge bending residues.
Probably only informative for interdomain rotations greater than 20 degrees