Actin-Like Protein 3

(All numbering and residues are taken from first PDB file)

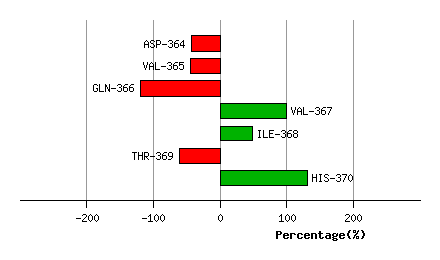
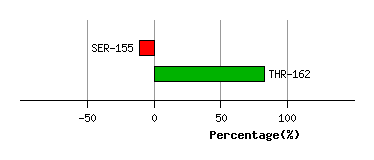
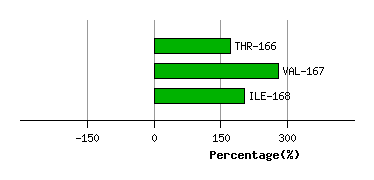
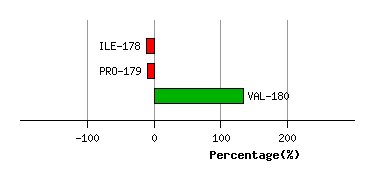
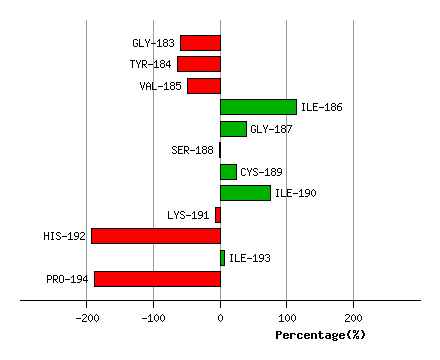
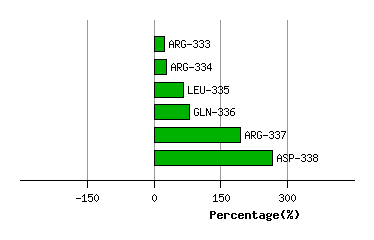
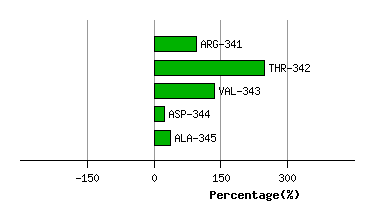
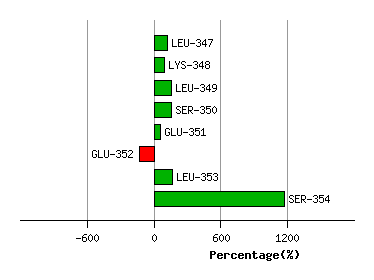
Bending Residue Dihedral Analysis

Residue
i
Residue
i+1
Distance of hinge axis to residue i in conformer 1
(A)
Distance of hinge axis to residue i in conformer 2
(A)
Change in psi (i)
(deg)
Change in phi (i+1)
(deg)
Angle of psi(i) axis to hinge axis conformer 1
(deg)
Angle of psi(i) axis to hinge axis conformer 2
(deg)
Percentage Progress
 LEU-149   ALA-150  13.1 13.5 -4.7 0.1 84.8 86.3 125.2
 ALA-150   ALA-151  16.3 16.6 7.7 -2.8 157.4 161.3 -117.2
 ALA-151   SER-152  16.3 16.6 3.7 -3.2 102.0 103.1 22.3

Downloading Image

Graph shows rotational transition at bending residues and can be used to identify hinge bending residues.
Probably only informative for interdomain rotations greater than 20 degrees


Residue
i
Residue
i+1
Distance of hinge axis to residue i in conformer 1
(A)
Distance of hinge axis to residue i in conformer 2
(A)
Change in psi (i)
(deg)
Change in phi (i+1)
(deg)
Angle of psi(i) axis to hinge axis conformer 1
(deg)
Angle of psi(i) axis to hinge axis conformer 2
(deg)
Percentage Progress
 THR-154   SER-155  16.6 16.6 3.5 -12.5 69.7 68.1 -40.3
 ARG-161   THR-162  15.3 15.1 23.5 -30.2 142.4 138.5 168.4

Downloading Image

Graph shows rotational transition at bending residues and can be used to identify hinge bending residues.
Probably only informative for interdomain rotations greater than 20 degrees


Residue
i
Residue
i+1
Distance of hinge axis to residue i in conformer 1
(A)
Distance of hinge axis to residue i in conformer 2
(A)
Change in psi (i)
(deg)
Change in phi (i+1)
(deg)
Angle of psi(i) axis to hinge axis conformer 1
(deg)
Angle of psi(i) axis to hinge axis conformer 2
(deg)
Percentage Progress
 GLY-165   THR-166  7.6 7.4 -9.1 16.5 73.1 68.2 -51.1
 THR-166   VAL-167  7.5 7.4 4.0 -9.4 153.6 149.7 109.1
 VAL-167   ILE-168  10.1 10.0 -26.6 24.9 58.3 56.1 -76.5

Downloading Image

Graph shows rotational transition at bending residues and can be used to identify hinge bending residues.
Probably only informative for interdomain rotations greater than 20 degrees


Residue
i
Residue
i+1
Distance of hinge axis to residue i in conformer 1
(A)
Distance of hinge axis to residue i in conformer 2
(A)
Change in psi (i)
(deg)
Change in phi (i+1)
(deg)
Angle of psi(i) axis to hinge axis conformer 1
(deg)
Angle of psi(i) axis to hinge axis conformer 2
(deg)
Percentage Progress
 VAL-177   ILE-178  12.1 12.0 -1.6 4.9 28.7 26.0 -45.9
 ILE-178   PRO-179  12.5 12.5 1.1 1.1 121.1 122.4 1.3
 PRO-179   VAL-180  10.1 10.1 -8.1 2.9 60.1 60.9 143.7

Downloading Image

Graph shows rotational transition at bending residues and can be used to identify hinge bending residues.
Probably only informative for interdomain rotations greater than 20 degrees


Residue
i
Residue
i+1
Distance of hinge axis to residue i in conformer 1
(A)
Distance of hinge axis to residue i in conformer 2
(A)
Change in psi (i)
(deg)
Change in phi (i+1)
(deg)
Angle of psi(i) axis to hinge axis conformer 1
(deg)
Angle of psi(i) axis to hinge axis conformer 2
(deg)
Percentage Progress
 GLU-182   GLY-183  12.5 12.6 25.6 -13.8 107.5 100.1 50.8
 GLY-183   TYR-184  15.3 15.5 -0.9 -5.3 92.3 94.8 -3.8
 TYR-184   VAL-185  15.6 15.6 10.9 -13.3 113.1 112.3 14.2
 VAL-185   ILE-186  15.1 14.9 11.3 -3.3 45.6 45.1 163.4
 ILE-186   GLY-187  13.8 13.7 1.9 0.1 110.3 110.1 -74.9
 GLY-187   SER-188  17.1 17.1 2.5 -4.3 84.0 90.2 -39.7
 SER-188   CYS-189  17.0 16.8 -2.2 3.0 56.5 52.1 25.8
 CYS-189   ILE-190  14.3 14.1 5.4 -6.3 173.2 171.6 50.3
 ILE-190   LYS-191  15.3 15.3 6.0 -3.1 112.9 117.7 -82.8
 LYS-191   HIS-192  16.1 16.2 -10.0 14.8 18.3 22.4 -185.5
 HIS-192   ILE-193  17.7 18.0 -15.5 11.2 51.5 50.8 198.8
 ILE-193   PRO-194  17.3 17.0 -6.5 10.5 40.3 39.6 -193.8

Downloading Image

Graph shows rotational transition at bending residues and can be used to identify hinge bending residues.
Probably only informative for interdomain rotations greater than 20 degrees


Residue
i
Residue
i+1
Distance of hinge axis to residue i in conformer 1
(A)
Distance of hinge axis to residue i in conformer 2
(A)
Change in psi (i)
(deg)
Change in phi (i+1)
(deg)
Angle of psi(i) axis to hinge axis conformer 1
(deg)
Angle of psi(i) axis to hinge axis conformer 2
(deg)
Percentage Progress
 GLN-305   ASN-306  8.8 9.0 -18.3 20.1 41.7 44.0 7.0
 ASN-306   CYS-307  10.8 11.2 12.0 -18.4 120.5 122.4 142.6
 CYS-307   PRO-308  8.6 8.6 8.1 -0.2 138.2 137.7 -100.3

Downloading Image

Graph shows rotational transition at bending residues and can be used to identify hinge bending residues.
Probably only informative for interdomain rotations greater than 20 degrees


Residue
i
Residue
i+1
Distance of hinge axis to residue i in conformer 1
(A)
Distance of hinge axis to residue i in conformer 2
(A)
Change in psi (i)
(deg)
Change in phi (i+1)
(deg)
Angle of psi(i) axis to hinge axis conformer 1
(deg)
Angle of psi(i) axis to hinge axis conformer 2
(deg)
Percentage Progress
 TYR-316   LYS-317  0.4 0.4 2.3 -2.9 119.4 121.3 -94.4
 LYS-317   ASN-318  3.4 3.5 -2.0 7.3 57.9 57.8 -93.2
 ASN-318   ILE-319  5.1 5.2 -6.2 3.4 66.3 64.4 32.1

Downloading Image

Graph shows rotational transition at bending residues and can be used to identify hinge bending residues.
Probably only informative for interdomain rotations greater than 20 degrees


Residue
i
Residue
i+1
Distance of hinge axis to residue i in conformer 1
(A)
Distance of hinge axis to residue i in conformer 2
(A)
Change in psi (i)
(deg)
Change in phi (i+1)
(deg)
Angle of psi(i) axis to hinge axis conformer 1
(deg)
Angle of psi(i) axis to hinge axis conformer 2
(deg)
Percentage Progress
 GLY-332   ARG-333  2.0 1.9 11.8 -10.7 91.1 94.4 -71.1
 ARG-333   ARG-334  1.6 1.7 -0.6 2.1 82.6 81.8 4.4
 ARG-334   LEU-335  4.1 4.2 -12.3 11.3 25.6 24.2 38.9
 LEU-335   GLN-336  4.2 4.4 -6.3 4.2 45.6 44.7 13.7
 GLN-336   ARG-337  3.0 2.9 0.3 -1.8 87.3 88.9 113.8
 ARG-337   ASP-338  6.5 6.3 14.2 -17.0 118.0 114.0 72.9

Downloading Image

Graph shows rotational transition at bending residues and can be used to identify hinge bending residues.
Probably only informative for interdomain rotations greater than 20 degrees


Residue
i
Residue
i+1
Distance of hinge axis to residue i in conformer 1
(A)
Distance of hinge axis to residue i in conformer 2
(A)
Change in psi (i)
(deg)
Change in phi (i+1)
(deg)
Angle of psi(i) axis to hinge axis conformer 1
(deg)
Angle of psi(i) axis to hinge axis conformer 2
(deg)
Percentage Progress
 LYS-340   ARG-341  7.7 7.9 1.9 -2.0 89.3 89.0 23.8
 ARG-341   THR-342  11.1 11.3 -9.3 12.8 135.6 136.3 152.5
 THR-342   VAL-343  11.4 11.6 -2.2 0.7 156.8 158.2 -111.9
 VAL-343   ASP-344  9.6 9.9 -7.1 -2.0 100.2 102.4 -113.4
 ASP-344   ALA-345  11.9 12.1 2.0 7.0 75.0 80.7 13.2

Downloading Image

Graph shows rotational transition at bending residues and can be used to identify hinge bending residues.
Probably only informative for interdomain rotations greater than 20 degrees


Residue
i
Residue
i+1
Distance of hinge axis to residue i in conformer 1
(A)
Distance of hinge axis to residue i in conformer 2
(A)
Change in psi (i)
(deg)
Change in phi (i+1)
(deg)
Angle of psi(i) axis to hinge axis conformer 1
(deg)
Angle of psi(i) axis to hinge axis conformer 2
(deg)
Percentage Progress
 ARG-346   LEU-347  14.1 14.4 -2.8 3.0 134.8 134.3 -17.0
 LEU-347   LYS-348  13.7 14.2 -14.8 8.3 86.4 86.7 -28.2
 LYS-348   LEU-349  17.2 17.6 9.2 -4.8 51.9 56.5 58.0
 LEU-349   SER-350  19.1 19.3 -23.3 22.4 168.1 169.7 0.4
 SER-350   GLU-351  17.8 17.9 -17.4 16.5 100.6 103.7 -94.0
 GLU-351   GLU-352  19.5 19.3 -18.1 39.9 87.6 85.7 -195.8
 GLU-352   LEU-353  22.3 22.3 -99.8 110.1 130.3 143.1 296.8
 LEU-353   SER-354  22.3 22.5 -27.3 62.1 154.1 148.5 1016.2

Downloading Image

Graph shows rotational transition at bending residues and can be used to identify hinge bending residues.
Probably only informative for interdomain rotations greater than 20 degrees


Residue
i
Residue
i+1
Distance of hinge axis to residue i in conformer 1
(A)
Distance of hinge axis to residue i in conformer 2
(A)
Change in psi (i)
(deg)
Change in phi (i+1)
(deg)
Angle of psi(i) axis to hinge axis conformer 1
(deg)
Angle of psi(i) axis to hinge axis conformer 2
(deg)
Percentage Progress
 ILE-363   ASP-364  7.1 7.1 -3.4 1.9 145.8 151.2 -103.7
 ASP-364   VAL-365  6.1 6.0 2.5 1.1 62.9 66.7 -0.7
 VAL-365   GLN-366  3.4 3.2 -13.4 11.0 138.2 139.7 -75.6
 GLN-366   VAL-367  3.0 3.2 -20.7 27.6 113.8 109.9 219.6
 VAL-367   ILE-368  2.8 2.5 -0.2 3.2 123.7 118.2 -51.4
 ILE-368   THR-369  6.4 6.3 -3.0 -3.2 139.0 138.2 -109.6
 THR-369   HIS-370  7.6 7.8 -5.2 5.6 104.9 106.4 191.7

Downloading Image

Graph shows rotational transition at bending residues and can be used to identify hinge bending residues.
Probably only informative for interdomain rotations greater than 20 degrees