Piezo-Type Mechanosensitive Ion Channel Component 1
(All numbering and residues are taken from first PDB file)
![]()
![]()
Bending Residue Dihedral Analysis
Residue
iResidue
i+1Distance of hinge axis to residue i in
(A) Distance of hinge axis to residue i in
(A) Change in
(deg) Change in
(deg) Angle of psi(i) axis to hinge axis
(deg) Angle of psi(i) axis to hinge axis
(deg) Percentage Progress
ALA-1326
ASN-1327
25.5
24.1
-0.1
0.4
76.9
74.3
8.9
ASN-1327
LEU-1328
22.2
21.2
-2.1
0.2
75.0
78.6
15.6
LEU-1328
LYS-1329
23.8
23.7
-0.7
0.3
143.3
150.0
-2.8
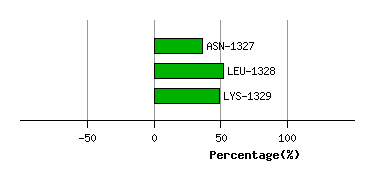
Graph shows rotational transition at bending residues and can be used
to identify hinge bending residues.
Probably only informative for interdomain rotations greater than 20 degrees
Residue
iResidue
i+1Distance of hinge axis to residue i in
(A) Distance of hinge axis to residue i in
(A) Change in
(deg) Change in
(deg) Angle of psi(i) axis to hinge axis
(deg) Angle of psi(i) axis to hinge axis
(deg) Percentage Progress
VAL-1498
LEU-1499
23.9
23.6
-3.0
1.6
138.3
132.4
-5.6
LEU-1499
SER-1500
26.9
27.0
0.2
0.5
54.6
43.9
4.8
SER-1500
THR-1501
24.9
25.4
7.1
2.3
50.2
50.7
23.2
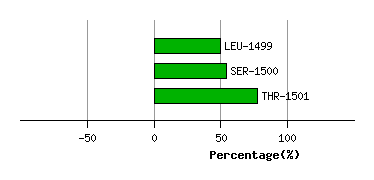
Graph shows rotational transition at bending residues and can be used
to identify hinge bending residues.
Probably only informative for interdomain rotations greater than 20 degrees
Residue
iResidue
i+1Distance of hinge axis to residue i in
(A) Distance of hinge axis to residue i in
(A) Change in
(deg) Change in
(deg) Angle of psi(i) axis to hinge axis
(deg) Angle of psi(i) axis to hinge axis
(deg) Percentage Progress
LEU-1708
VAL-1709
21.9
22.2
-2.0
-7.5
46.3
41.5
52.8
VAL-1709
LEU-1710
20.7
20.7
-17.7
22.7
103.2
88.1
8.2
LEU-1710
PRO-1711
19.9
20.2
6.5
-1.8
55.7
57.2
37.1
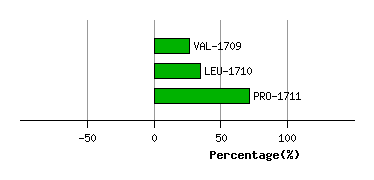
Graph shows rotational transition at bending residues and can be used
to identify hinge bending residues.
Probably only informative for interdomain rotations greater than 20 degrees
Residue
iResidue
i+1Distance of hinge axis to residue i in
(A) Distance of hinge axis to residue i in
(A) Change in
(deg) Change in
(deg) Angle of psi(i) axis to hinge axis
(deg) Angle of psi(i) axis to hinge axis
(deg) Percentage Progress
VAL-1714
PHE-1715
14.5
15.9
10.6
15.4
97.4
118.1
-36.7
PHE-1715
LEU-1716
11.3
12.8
-29.2
51.3
144.0
133.7
51.8
LEU-1716
TRP-1717
10.2
10.4
-23.3
55.9
128.5
122.7
57.6
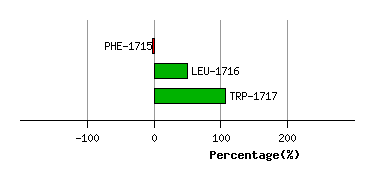
Graph shows rotational transition at bending residues and can be used
to identify hinge bending residues.
Probably only informative for interdomain rotations greater than 20 degrees
Residue
iResidue
i+1Distance of hinge axis to residue i in
(A) Distance of hinge axis to residue i in
(A) Change in
(deg) Change in
(deg) Angle of psi(i) axis to hinge axis
(deg) Angle of psi(i) axis to hinge axis
(deg) Percentage Progress
ASP-1975
VAL-1976
7.7
11.4
2.6
-3.0
47.9
16.7
-9.3
VAL-1976
TYR-1977
4.6
9.3
52.0
2.8
80.6
88.5
19.9
TYR-1977
ALA-1978
3.4
7.0
-0.1
-5.5
157.0
149.0
5.4
ALA-1978
LEU-1979
3.0
6.3
7.4
6.2
82.5
80.0
21.9
LEU-1979
MET-1980
1.4
4.8
-0.4
-3.5
59.7
60.1
0.6
MET-1980
PHE-1981
1.9
2.2
2.9
-0.5
59.0
60.6
0.0
PHE-1981
LEU-1982
4.0
2.9
-4.1
-3.9
144.8
145.4
-22.4
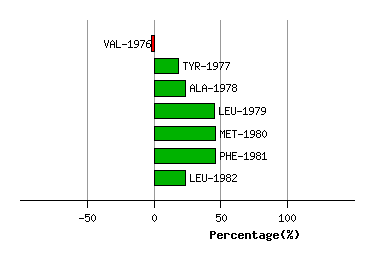
Graph shows rotational transition at bending residues and can be used
to identify hinge bending residues.
Probably only informative for interdomain rotations greater than 20 degrees
Residue
iResidue
i+1Distance of hinge axis to residue i in
(A) Distance of hinge axis to residue i in
(A) Change in
(deg) Change in
(deg) Angle of psi(i) axis to hinge axis
(deg) Angle of psi(i) axis to hinge axis
(deg) Percentage Progress
LEU-2037
TYR-2038
8.7
7.8
1.0
6.0
65.9
65.5
9.9
TYR-2038
LEU-2039
8.0
8.7
-5.2
-8.8
89.4
77.1
-5.8
LEU-2039
ARG-2040
11.8
12.3
2.3
-25.8
156.3
165.5
75.8
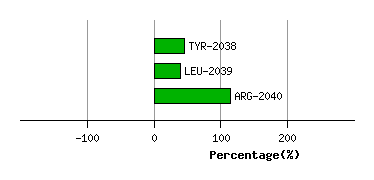
Graph shows rotational transition at bending residues and can be used
to identify hinge bending residues.
Probably only informative for interdomain rotations greater than 20 degrees
Residue
iResidue
i+1Distance of hinge axis to residue i in
(A) Distance of hinge axis to residue i in
(A) Change in
(deg) Change in
(deg) Angle of psi(i) axis to hinge axis
(deg) Angle of psi(i) axis to hinge axis
(deg) Percentage Progress
ASN-2076
ALA-2077
25.3
24.2
-6.4
-60.7
86.7
93.3
-3.4
ALA-2077
VAL-2078
23.2
21.4
0.8
-7.2
88.8
101.5
-22.1
VAL-2078
ALA-2079
20.8
18.7
0.4
1.1
17.6
35.7
-7.5
ALA-2079
GLN-2080
20.9
18.3
3.3
1.3
106.0
121.9
1.8
ALA-2079
GLN-2080
20.9
18.3
3.3
1.3
106.0
121.9
1.8
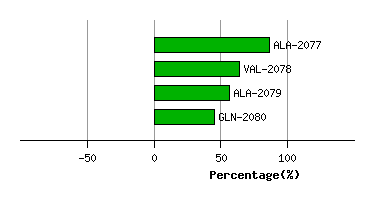
Graph shows rotational transition at bending residues and can be used
to identify hinge bending residues.
Probably only informative for interdomain rotations greater than 20 degrees
Residue
iResidue
i+1Distance of hinge axis to residue i in
(A) Distance of hinge axis to residue i in
(A) Change in
(deg) Change in
(deg) Angle of psi(i) axis to hinge axis
(deg) Angle of psi(i) axis to hinge axis
(deg) Percentage Progress
ALA-2079
GLN-2080
20.9
18.3
3.3
1.3
106.0
121.9
1.8
ALA-2079
GLN-2080
20.9
18.3
3.3
1.3
106.0
121.9
1.8
GLN-2080
LEU-2081
20.4
18.2
8.1
5.1
68.1
63.6
5.1
LEU-2081
TRP-2082
17.5
15.8
-4.1
-1.8
63.0
67.0
-5.1
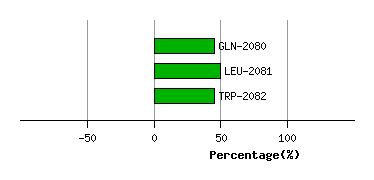
Graph shows rotational transition at bending residues and can be used
to identify hinge bending residues.
Probably only informative for interdomain rotations greater than 20 degrees
Residue
iResidue
i+1Distance of hinge axis to residue i in
(A) Distance of hinge axis to residue i in
(A) Change in
(deg) Change in
(deg) Angle of psi(i) axis to hinge axis
(deg) Angle of psi(i) axis to hinge axis
(deg) Percentage Progress
TYR-2095
GLN-2096
6.6
8.4
-0.6
0.3
96.0
87.4
9.4
GLN-2096
ILE-2097
4.4
7.1
4.9
3.6
16.3
24.9
14.4
ILE-2097
ARG-2098
3.5
5.8
3.5
3.2
64.4
61.2
13.4
ARG-2098
CYS-2099
7.0
9.1
-1.8
4.7
75.0
75.5
9.8
CYS-2099
GLY-2100
8.9
11.1
0.6
-34.5
72.5
72.5
-35.5
GLY-2100
TYR-2101
7.8
9.7
75.8
123.5
139.3
127.0
387.5
TYR-2101
PRO-2102
8.9
13.0
-94.3
27.4
85.1
36.7
-508.5
PRO-2102
THR-2103
12.3
12.0
161.8
21.9
98.0
101.9
54.7
THR-2103
ARG-2104
15.1
15.6
146.9
-138.0
171.1
131.9
-31.3
ARG-2104
ILE-2105
16.1
17.0
57.5
-47.2
118.9
143.0
-34.5
ILE-2105
LEU-2106
12.9
15.8
-169.4
-100.6
41.0
38.9
-237.2
LEU-2106
GLY-2107
14.9
16.6
11.6
-177.8
153.8
127.6
483.0
GLY-2107
ASN-2108
14.8
14.5
17.6
3.9
116.2
88.1
-17.8
ASN-2108
PHE-2109
12.2
11.7
-19.1
13.5
74.5
48.7
11.7
PHE-2109
LEU-2110
10.0
13.9
-20.0
27.5
12.2
43.7
-6.9
LEU-2110
THR-2111
10.3
11.1
-35.2
37.3
69.7
47.9
-18.9
THR-2111
LYS-2112
14.1
10.5
-69.2
14.6
113.0
70.7
-3.3
LYS-2112
LYS-2113
15.0
14.4
31.4
49.1
139.2
128.0
-177.1
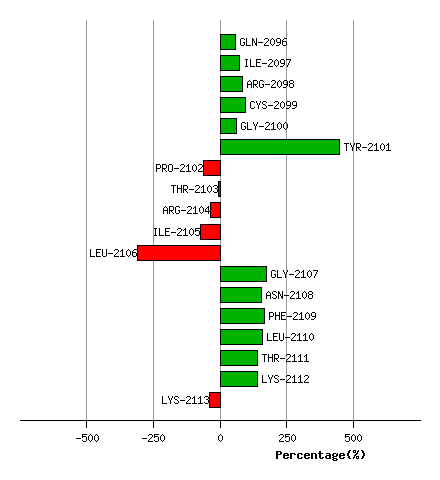
Graph shows rotational transition at bending residues and can be used
to identify hinge bending residues.
Probably only informative for interdomain rotations greater than 20 degrees