Wss1p
(All numbering and residues are taken from first PDB file)
![]()
![]()
Bending Residue Dihedral Analysis
Residue
iResidue
i+1Distance of hinge axis to residue i in
(A) Distance of hinge axis to residue i in
(A) Change in
(deg) Change in
(deg) Angle of psi(i) axis to hinge axis
(deg) Angle of psi(i) axis to hinge axis
(deg) Percentage Progress
PRO-27
HIS-28
3.5
3.6
12.1
8.4
23.6
22.1
389.9
HIS-28
ILE-29
3.7
3.9
-1.0
1.8
120.0
119.2
-14.1
ILE-29
GLN-30
3.5
3.7
-0.7
1.5
52.2
51.9
-8.2
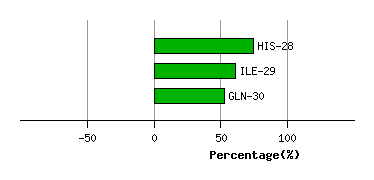
Graph shows rotational transition at bending residues and can be used
to identify hinge bending residues.
Probably only informative for interdomain rotations greater than 20 degrees
Residue
iResidue
i+1Distance of hinge axis to residue i in
(A) Distance of hinge axis to residue i in
(A) Change in
(deg) Change in
(deg) Angle of psi(i) axis to hinge axis
(deg) Angle of psi(i) axis to hinge axis
(deg) Percentage Progress
VAL-55
SER-56
6.4
6.3
1.2
2.1
69.2
66.7
44.4
SER-56
TYR-57
4.8
4.8
-6.2
0.0
83.2
82.2
78.4
TYR-57
LEU-58
8.3
8.2
6.3
-0.2
159.3
162.2
-122.6
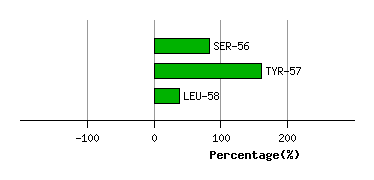
Graph shows rotational transition at bending residues and can be used
to identify hinge bending residues.
Probably only informative for interdomain rotations greater than 20 degrees
Residue
iResidue
i+1Distance of hinge axis to residue i in
(A) Distance of hinge axis to residue i in
(A) Change in
(deg) Change in
(deg) Angle of psi(i) axis to hinge axis
(deg) Angle of psi(i) axis to hinge axis
(deg) Percentage Progress
HIS-63
PHE-64
9.2
9.2
2.8
-1.1
65.3
61.9
20.0
PHE-64
LYS-65
5.7
5.6
-0.3
-1.6
48.2
48.5
6.3
LYS-65
VAL-66
5.2
5.2
0.6
-0.9
62.7
60.5
-45.0
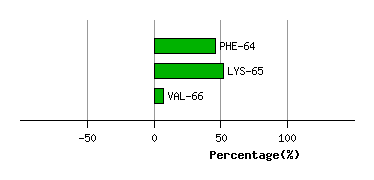
Graph shows rotational transition at bending residues and can be used
to identify hinge bending residues.
Probably only informative for interdomain rotations greater than 20 degrees
Residue
iResidue
i+1Distance of hinge axis to residue i in
(A) Distance of hinge axis to residue i in
(A) Change in
(deg) Change in
(deg) Angle of psi(i) axis to hinge axis
(deg) Angle of psi(i) axis to hinge axis
(deg) Percentage Progress
LEU-114
HIS-115
7.0
7.1
-2.5
-3.1
19.0
18.1
124.9
HIS-115
GLU-116
6.5
6.7
2.5
-2.4
88.2
91.3
-29.8
GLU-116
LEU-117
3.8
3.9
1.5
0.4
66.9
65.7
22.2
LEU-117
THR-118
2.3
2.3
1.5
-0.5
44.2
46.4
-12.4
LEU-117
THR-118
2.3
2.3
1.5
-0.5
44.2
46.4
-12.4
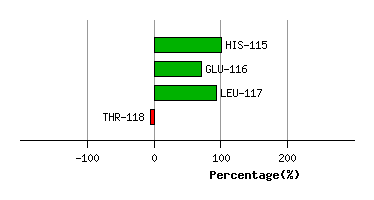
Graph shows rotational transition at bending residues and can be used
to identify hinge bending residues.
Probably only informative for interdomain rotations greater than 20 degrees
Residue
iResidue
i+1Distance of hinge axis to residue i in
(A) Distance of hinge axis to residue i in
(A) Change in
(deg) Change in
(deg) Angle of psi(i) axis to hinge axis
(deg) Angle of psi(i) axis to hinge axis
(deg) Percentage Progress
LEU-117
THR-118
2.3
2.3
1.5
-0.5
44.2
46.4
-12.4
LEU-117
THR-118
2.3
2.3
1.5
-0.5
44.2
46.4
-12.4
THR-118
HIS-119
4.1
4.1
2.4
1.1
55.8
55.4
77.4
HIS-119
ASN-120
1.0
1.1
1.4
-0.7
116.6
118.0
-24.0
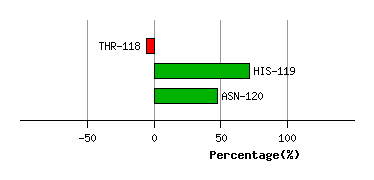
Graph shows rotational transition at bending residues and can be used
to identify hinge bending residues.
Probably only informative for interdomain rotations greater than 20 degrees
Residue
iResidue
i+1Distance of hinge axis to residue i in
(A) Distance of hinge axis to residue i in
(A) Change in
(deg) Change in
(deg) Angle of psi(i) axis to hinge axis
(deg) Angle of psi(i) axis to hinge axis
(deg) Percentage Progress
LEU-121
PHE-122
5.9
6.0
0.1
1.4
172.6
171.2
-56.4
PHE-122
GLY-123
4.5
4.6
-1.4
4.0
71.1
72.1
16.1
GLY-123
PRO-124
2.1
2.3
0.0
-3.1
127.6
126.2
42.8
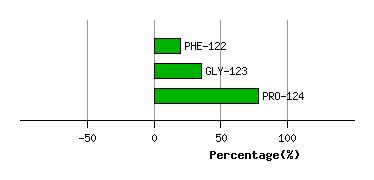
Graph shows rotational transition at bending residues and can be used
to identify hinge bending residues.
Probably only informative for interdomain rotations greater than 20 degrees