Alkaline Thermostable Endoxylanase
(All numbering and residues are taken from first PDB file)
![]()
![]()
Bending Residue Dihedral Analysis
Residue
iResidue
i+1Distance of hinge axis to residue i in
(A) Distance of hinge axis to residue i in
(A) Change in
(deg) Change in
(deg) Angle of psi(i) axis to hinge axis
(deg) Angle of psi(i) axis to hinge axis
(deg) Percentage Progress
HIS-28
GLN-29
4.5
4.6
-6.1
3.6
80.1
76.7
27.1
GLN-29
LEU-30
7.4
7.4
12.6
-6.8
94.6
98.5
-85.3
LEU-30
ASN-31
7.5
7.5
-6.5
-1.9
141.6
135.8
-112.1
ASN-31
GLY-32
9.4
9.6
10.8
0.8
88.8
90.0
75.3
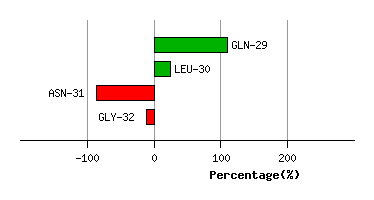
Graph shows rotational transition at bending residues and can be used
to identify hinge bending residues.
Probably only informative for interdomain rotations greater than 20 degrees
Residue
iResidue
i+1Distance of hinge axis to residue i in
(A) Distance of hinge axis to residue i in
(A) Change in
(deg) Change in
(deg) Angle of psi(i) axis to hinge axis
(deg) Angle of psi(i) axis to hinge axis
(deg) Percentage Progress
VAL-46
ALA-47
3.9
3.7
1.1
-2.4
42.5
39.9
44.2
ALA-47
GLU-48
1.5
1.4
-2.2
0.1
68.7
70.3
-1.5
GLU-48
ASN-49
4.9
4.9
5.6
-2.8
90.7
87.9
-56.0
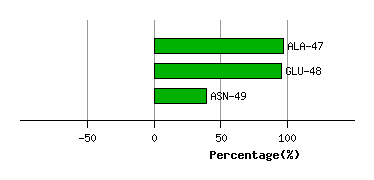
Graph shows rotational transition at bending residues and can be used
to identify hinge bending residues.
Probably only informative for interdomain rotations greater than 20 degrees
Residue
iResidue
i+1Distance of hinge axis to residue i in
(A) Distance of hinge axis to residue i in
(A) Change in
(deg) Change in
(deg) Angle of psi(i) axis to hinge axis
(deg) Angle of psi(i) axis to hinge axis
(deg) Percentage Progress
ASN-78
ASN-79
15.0
14.7
2.3
-4.1
16.7
17.6
-34.9
ASN-79
MET-80
16.0
15.8
-4.1
-6.6
130.8
133.1
-242.7
MET-80
ASN-81
13.0
12.9
-6.4
7.4
129.3
128.1
166.0
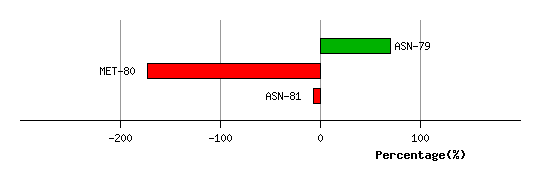
Graph shows rotational transition at bending residues and can be used
to identify hinge bending residues.
Probably only informative for interdomain rotations greater than 20 degrees
Residue
iResidue
i+1Distance of hinge axis to residue i in
(A) Distance of hinge axis to residue i in
(A) Change in
(deg) Change in
(deg) Angle of psi(i) axis to hinge axis
(deg) Angle of psi(i) axis to hinge axis
(deg) Percentage Progress
PHE-84
HIS-85
3.4
3.3
2.8
-6.6
114.4
111.8
93.4
HIS-85
THR-86
1.9
2.0
3.5
10.6
57.2
57.4
-109.0
THR-86
LEU-87
4.7
4.8
2.1
2.5
89.9
90.1
18.9
LEU-87
VAL-88
8.0
8.0
-7.6
7.7
75.7
75.5
66.0
VAL-88
TRP-89
9.6
9.8
8.5
-6.2
92.7
93.6
-0.7
TRP-89
HIS-90
10.6
10.7
1.2
-3.0
84.3
80.1
-104.2
HIS-90
ASN-91
14.1
14.3
18.4
-17.9
30.5
33.1
80.2
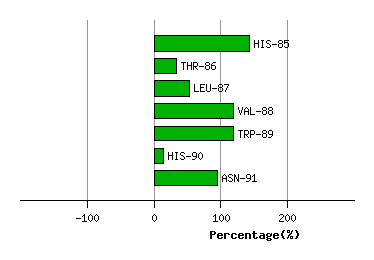
Graph shows rotational transition at bending residues and can be used
to identify hinge bending residues.
Probably only informative for interdomain rotations greater than 20 degrees
Residue
iResidue
i+1Distance of hinge axis to residue i in
(A) Distance of hinge axis to residue i in
(A) Change in
(deg) Change in
(deg) Angle of psi(i) axis to hinge axis
(deg) Angle of psi(i) axis to hinge axis
(deg) Percentage Progress
THR-128
HIS-129
18.6
18.7
2.1
-2.4
123.7
123.5
-158.9
HIS-129
ILE-130
15.3
15.3
-1.2
0.5
108.4
107.5
140.2
ILE-130
LYS-131
13.4
13.3
7.9
-16.8
103.9
105.0
240.5
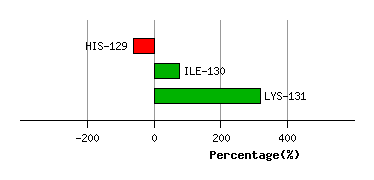
Graph shows rotational transition at bending residues and can be used
to identify hinge bending residues.
Probably only informative for interdomain rotations greater than 20 degrees
Residue
iResidue
i+1Distance of hinge axis to residue i in
(A) Distance of hinge axis to residue i in
(A) Change in
(deg) Change in
(deg) Angle of psi(i) axis to hinge axis
(deg) Angle of psi(i) axis to hinge axis
(deg) Percentage Progress
VAL-133
VAL-134
12.2
12.1
-2.5
2.8
66.5
65.5
-22.5
VAL-134
GLU-135
12.6
12.2
-0.5
-3.8
115.3
115.6
60.9
GLU-135
ARG-136
15.8
15.5
-2.5
5.4
146.1
148.8
1.8
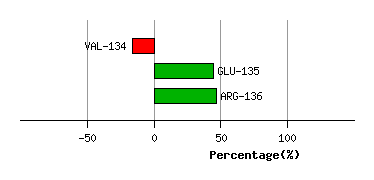
Graph shows rotational transition at bending residues and can be used
to identify hinge bending residues.
Probably only informative for interdomain rotations greater than 20 degrees
Residue
iResidue
i+1Distance of hinge axis to residue i in
(A) Distance of hinge axis to residue i in
(A) Change in
(deg) Change in
(deg) Angle of psi(i) axis to hinge axis
(deg) Angle of psi(i) axis to hinge axis
(deg) Percentage Progress
ASP-140
VAL-141
11.9
11.9
6.8
3.8
46.5
52.6
200.9
VAL-141
THR-142
9.3
9.1
-5.2
3.1
145.0
145.1
-305.2
THR-142
ALA-143
10.0
9.9
2.1
5.1
41.4
39.9
126.8
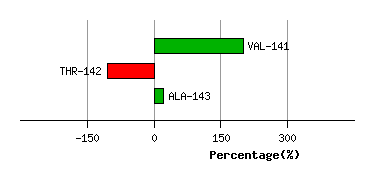
Graph shows rotational transition at bending residues and can be used
to identify hinge bending residues.
Probably only informative for interdomain rotations greater than 20 degrees
Residue
iResidue
i+1Distance of hinge axis to residue i in
(A) Distance of hinge axis to residue i in
(A) Change in
(deg) Change in
(deg) Angle of psi(i) axis to hinge axis
(deg) Angle of psi(i) axis to hinge axis
(deg) Percentage Progress
SER-164
VAL-165
18.2
18.1
-1.5
5.7
92.9
95.8
97.6
VAL-165
TRP-166
20.0
19.8
-0.4
-7.6
65.2
65.7
126.3
TRP-166
TYR-167
17.5
17.4
4.5
-10.3
167.6
166.6
103.8
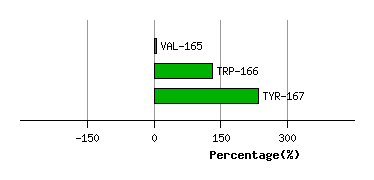
Graph shows rotational transition at bending residues and can be used
to identify hinge bending residues.
Probably only informative for interdomain rotations greater than 20 degrees
Residue
iResidue
i+1Distance of hinge axis to residue i in
(A) Distance of hinge axis to residue i in
(A) Change in
(deg) Change in
(deg) Angle of psi(i) axis to hinge axis
(deg) Angle of psi(i) axis to hinge axis
(deg) Percentage Progress
ASP-172
GLU-173
14.7
14.9
7.7
-6.9
112.5
110.1
-212.5
GLU-173
TYR-174
16.1
16.2
3.0
-3.6
150.3
149.5
60.6
TYR-174
ILE-175
14.8
14.9
2.9
2.4
85.1
83.2
73.6
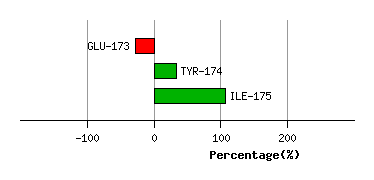
Graph shows rotational transition at bending residues and can be used
to identify hinge bending residues.
Probably only informative for interdomain rotations greater than 20 degrees