Thiol:disulfide Interchange Protein
(All numbering and residues are taken from first PDB file)
![]()
![]()
Bending Residue Dihedral Analysis
Residue
iResidue
i+1Distance of hinge axis to residue i in
(A) Distance of hinge axis to residue i in
(A) Change in
(deg) Change in
(deg) Angle of psi(i) axis to hinge axis
(deg) Angle of psi(i) axis to hinge axis
(deg) Percentage Progress
SER-17
ASP-18
10.7
8.3
-166.3
-13.1
84.6
55.4
-410.7
ASP-18
ILE-19
9.3
8.4
8.8
-35.3
164.8
146.6
102.1
ILE-19
GLN-20
11.2
10.8
7.8
-19.8
117.5
123.2
58.6
GLN-20
PRO-21
9.7
10.7
-1.8
-7.6
152.6
151.1
-22.3
GLN-20
PRO-21
9.7
10.7
-1.8
-7.6
152.6
151.1
-22.3
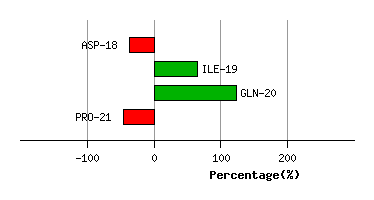
Graph shows rotational transition at bending residues and can be used
to identify hinge bending residues.
Probably only informative for interdomain rotations greater than 20 degrees
Residue
iResidue
i+1Distance of hinge axis to residue i in
(A) Distance of hinge axis to residue i in
(A) Change in
(deg) Change in
(deg) Angle of psi(i) axis to hinge axis
(deg) Angle of psi(i) axis to hinge axis
(deg) Percentage Progress
GLN-20
PRO-21
9.7
10.7
-1.8
-7.6
152.6
151.1
-22.3
GLN-20
PRO-21
9.7
10.7
-1.8
-7.6
152.6
151.1
-22.3
PRO-21
ALA-22
11.1
12.5
-21.2
44.6
125.5
126.9
111.6
ALA-22
PRO-23
9.7
10.3
8.7
8.0
27.9
29.4
83.5
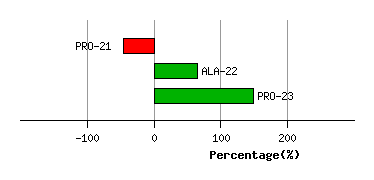
Graph shows rotational transition at bending residues and can be used
to identify hinge bending residues.
Probably only informative for interdomain rotations greater than 20 degrees
Residue
iResidue
i+1Distance of hinge axis to residue i in
(A) Distance of hinge axis to residue i in
(A) Change in
(deg) Change in
(deg) Angle of psi(i) axis to hinge axis
(deg) Angle of psi(i) axis to hinge axis
(deg) Percentage Progress
TYR-52
ASP-53
4.4
4.2
-11.3
14.8
55.1
50.5
-16.1
ASP-53
VAL-54
2.9
2.9
9.7
-2.8
149.9
140.2
-58.6
VAL-54
SER-55
2.4
1.9
-19.2
-29.1
50.3
48.2
191.1
SER-55
GLY-56
3.9
3.6
18.5
4.6
102.2
70.6
55.2
GLY-56
THR-57
2.8
4.8
3.7
12.8
110.6
108.0
-42.7
THR-57
ALA-58
3.4
6.5
28.7
-69.1
56.6
80.1
-106.4
ALA-58
PRO-59
4.4
4.6
-0.6
19.9
128.5
125.4
88.5
PRO-59
VAL-60
3.6
2.8
-0.3
-15.5
150.5
167.1
-46.6
VAL-60
ASN-61
2.4
1.7
5.9
-18.0
46.7
55.8
-24.6
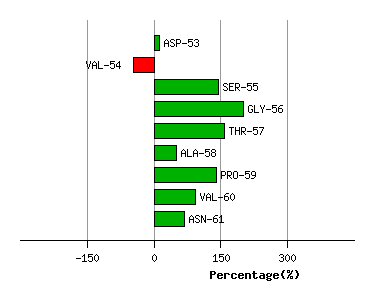
Graph shows rotational transition at bending residues and can be used
to identify hinge bending residues.
Probably only informative for interdomain rotations greater than 20 degrees