L-3-Hydroxyacyl-Coa Dehydrogenase
(All numbering and residues are taken from first PDB file)
![]()
![]()
Bending Residue Dihedral Analysis
Residue
iResidue
i+1Distance of hinge axis to residue i in
(A) Distance of hinge axis to residue i in
(A) Change in
(deg) Change in
(deg) Angle of psi(i) axis to hinge axis
(deg) Angle of psi(i) axis to hinge axis
(deg) Percentage Progress
VAL-197
SER-198
4.4
3.7
-39.0
36.3
152.5
154.1
-17.7
SER-198
CYS-199
6.4
5.9
-27.4
40.2
137.8
133.4
87.0
CYS-199
LYS-200
6.1
5.0
6.8
2.0
35.1
28.3
69.4
LYS-200
ASP-201
7.0
6.4
-19.4
-1.4
118.5
121.3
-112.4
ASP-201
THR-202
4.6
4.3
14.7
-17.9
48.8
44.8
-5.1
THR-202
PRO-203
4.3
3.7
0.4
5.6
99.1
96.3
-15.6
PRO-203
GLY-204
3.6
3.4
-2.3
-7.0
36.4
35.5
52.8
GLY-204
PHE-205
5.0
4.8
4.4
-0.1
143.3
144.0
-22.4
PHE-205
ILE-206
3.5
3.3
1.2
2.1
119.3
115.4
-5.0
ILE-206
VAL-207
6.0
6.0
-12.1
3.0
80.2
84.3
4.2
VAL-207
ASN-208
7.1
7.5
6.4
8.0
42.8
39.8
73.4
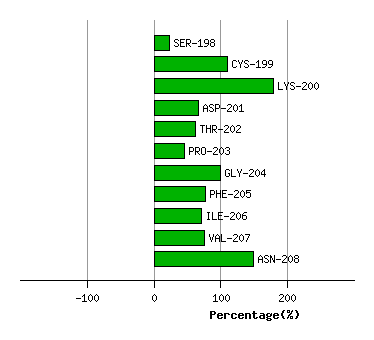
Graph shows rotational transition at bending residues and can be used
to identify hinge bending residues.
Probably only informative for interdomain rotations greater than 20 degrees