Sarcoplasmic/endoplasmic Reticulum Calcium Atpase 1 Isoform Serca1a
(All numbering and residues are taken from first PDB file)
![]()
![]()
Bending Residue Dihedral Analysis
Residue
iResidue
i+1Distance of hinge axis to residue i in
(A) Distance of hinge axis to residue i in
(A) Change in
(deg) Change in
(deg) Angle of psi(i) axis to hinge axis
(deg) Angle of psi(i) axis to hinge axis
(deg) Percentage Progress
ALA-43
GLU-44
13.2
14.8
-86.2
-147.5
58.0
47.9
-70.7
GLU-44
GLU-45
11.4
12.5
175.9
-20.7
168.5
144.5
-124.8
GLU-45
GLY-46
11.9
13.8
-85.0
-145.7
64.1
36.5
197.1
GLY-46
LYS-47
10.3
11.8
-27.3
70.4
108.3
38.8
-17.9
LYS-47
SER-48
6.6
14.4
167.5
90.1
140.5
134.2
68.0
SER-48
LEU-49
6.4
14.8
39.5
16.6
130.2
149.6
-44.7
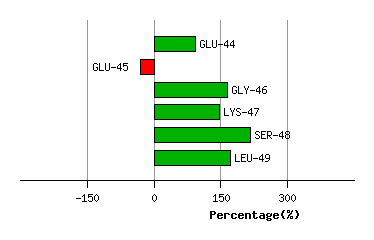
Graph shows rotational transition at bending residues and can be used
to identify hinge bending residues.
Probably only informative for interdomain rotations greater than 20 degrees
Residue
iResidue
i+1Distance of hinge axis to residue i in
(A) Distance of hinge axis to residue i in
(A) Change in
(deg) Change in
(deg) Angle of psi(i) axis to hinge axis
(deg) Angle of psi(i) axis to hinge axis
(deg) Percentage Progress
ASN-111
ALA-112
10.1
2.6
40.8
-5.9
150.0
131.2
-23.6
ALA-112
GLU-113
8.9
2.1
-108.2
-114.2
36.4
21.9
-108.7
GLU-113
ASN-114
7.5
2.8
158.5
-13.8
104.8
124.2
212.2
ASN-114
ALA-115
11.1
5.8
-165.8
-13.9
57.9
28.1
-107.0
ALA-115
ILE-116
12.7
5.5
19.9
-9.1
160.5
134.3
-8.6
ILE-116
GLU-117
10.4
7.5
7.1
9.8
128.9
94.3
-11.9
GLU-117
ALA-118
10.9
6.2
-8.2
-2.0
77.3
52.2
7.2
ALA-118
LEU-119
14.6
2.8
13.1
8.4
140.8
167.1
-18.7
LEU-119
LYS-120
14.4
4.6
16.5
-10.1
150.8
110.3
-2.3
LYS-120
GLU-121
11.8
6.8
37.4
-8.4
115.1
102.9
-13.3
GLU-121
TYR-122
14.1
5.0
11.1
-44.5
105.6
168.5
18.5
TYR-122
GLU-123
17.1
4.2
63.1
-5.5
165.9
124.1
-50.0
GLU-123
PRO-124
17.3
7.9
-7.4
3.0
53.9
77.6
11.6
PRO-124
GLU-125
16.7
9.6
4.8
6.4
146.8
80.2
-0.3
GLU-125
MET-126
14.0
13.3
-168.1
-5.3
36.4
32.1
153.9
MET-126
GLY-127
15.5
14.4
10.2
-12.0
139.7
139.3
0.2
GLY-127
LYS-128
14.2
13.4
17.5
-20.8
143.1
139.8
-0.1
Graph shows rotational transition at bending residues and can be used
to identify hinge bending residues.
Probably only informative for interdomain rotations greater than 20 degrees
Residue
iResidue
i+1Distance of hinge axis to residue i in
(A) Distance of hinge axis to residue i in
(A) Change in
(deg) Change in
(deg) Angle of psi(i) axis to hinge axis
(deg) Angle of psi(i) axis to hinge axis
(deg) Percentage Progress
LYS-234
ILE-235
13.7
14.2
-15.4
52.5
42.7
37.6
-18.9
ILE-235
ARG-236
12.0
12.2
-54.6
9.5
34.6
29.8
45.2
ARG-236
ASP-237
9.8
11.6
21.1
-21.9
156.0
111.5
-3.9
ASP-237
GLN-238
11.7
15.4
-12.6
33.2
79.4
64.0
-3.2
GLN-238
MET-239
12.2
16.0
-174.0
122.0
97.0
26.2
-15.4
MET-239
ALA-240
11.1
13.4
-165.7
-23.6
25.1
43.2
157.5
ALA-240
ALA-241
12.1
14.9
-132.7
-81.9
91.1
75.7
-67.3
ALA-241
THR-242
8.8
18.4
-110.7
-7.8
130.7
52.1
-15.7
THR-242
GLU-243
8.0
17.6
101.4
-2.9
123.3
165.5
-83.3
GLU-243
GLN-244
6.7
18.2
-41.0
34.8
64.1
69.0
37.3
GLN-244
ASP-245
8.9
17.2
-40.4
15.5
28.0
16.7
22.9
ASP-245
LYS-246
11.4
19.3
0.3
-2.9
102.6
134.1
11.6
LYS-246
THR-247
11.3
17.9
-23.2
26.7
110.5
81.5
8.6
THR-247
PRO-248
13.3
17.9
-6.8
-20.7
68.8
52.6
19.0
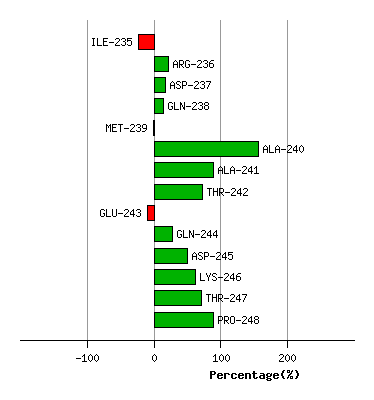
Graph shows rotational transition at bending residues and can be used
to identify hinge bending residues.
Probably only informative for interdomain rotations greater than 20 degrees