Macrophage Mannose Receptor 1
(All numbering and residues are taken from first PDB file)
![]()
![]()
Bending Residue Dihedral Analysis
Residue
iResidue
i+1Distance of hinge axis to residue i in
(A) Distance of hinge axis to residue i in
(A) Change in
(deg) Change in
(deg) Angle of psi(i) axis to hinge axis
(deg) Angle of psi(i) axis to hinge axis
(deg) Percentage Progress
SER-296
PRO-297
3.6
3.7
-5.4
8.0
58.9
58.9
-0.9
PRO-297
PHE-298
4.1
3.8
-4.3
-4.3
11.1
15.6
75.6
PHE-298
ARG-299
5.2
5.1
-0.7
5.7
58.8
59.8
-38.8
ARG-299
TYR-300
4.1
4.0
-20.1
15.8
149.5
155.8
-20.3
ARG-299
TYR-300
4.1
4.0
-20.1
15.8
149.5
155.8
-20.3
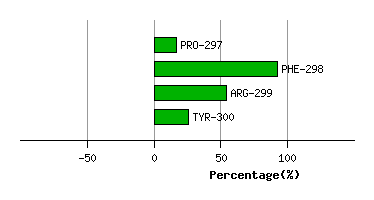
Graph shows rotational transition at bending residues and can be used
to identify hinge bending residues.
Probably only informative for interdomain rotations greater than 20 degrees
Residue
iResidue
i+1Distance of hinge axis to residue i in
(A) Distance of hinge axis to residue i in
(A) Change in
(deg) Change in
(deg) Angle of psi(i) axis to hinge axis
(deg) Angle of psi(i) axis to hinge axis
(deg) Percentage Progress
ARG-299
TYR-300
4.1
4.0
-20.1
15.8
149.5
155.8
-20.3
ARG-299
TYR-300
4.1
4.0
-20.1
15.8
149.5
155.8
-20.3
TYR-300
LEU-301
1.6
1.6
-10.6
14.3
120.5
119.3
43.2
LEU-301
ASN-302
3.2
3.4
12.2
-9.6
45.2
43.0
22.3
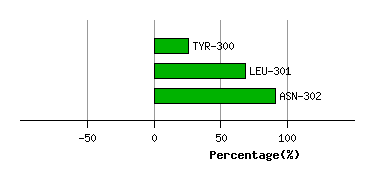
Graph shows rotational transition at bending residues and can be used
to identify hinge bending residues.
Probably only informative for interdomain rotations greater than 20 degrees
Residue
iResidue
i+1Distance of hinge axis to residue i in
(A) Distance of hinge axis to residue i in
(A) Change in
(deg) Change in
(deg) Angle of psi(i) axis to hinge axis
(deg) Angle of psi(i) axis to hinge axis
(deg) Percentage Progress
ILE-339
CYS-340
16.0
16.0
0.9
-12.9
26.5
23.4
-51.1
CYS-340
LYS-341
15.2
15.2
-10.3
11.6
93.3
98.2
66.7
LYS-341
LYS-342
12.7
12.6
-28.1
6.8
169.7
167.9
-128.3
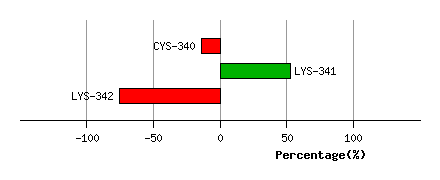
Graph shows rotational transition at bending residues and can be used
to identify hinge bending residues.
Probably only informative for interdomain rotations greater than 20 degrees