Alcohol Dehydrogenase 1
(All numbering and residues are taken from first PDB file)
![]()
![]()
Bending Residue Dihedral Analysis
Residue
iResidue
i+1Distance of hinge axis to residue i in
(A) Distance of hinge axis to residue i in
(A) Change in
(deg) Change in
(deg) Angle of psi(i) axis to hinge axis
(deg) Angle of psi(i) axis to hinge axis
(deg) Percentage Progress
ALA-154
GLY-155
11.5
11.8
11.5
-14.7
90.3
89.9
12.0
GLY-155
ILE-156
8.2
8.5
3.0
-5.0
141.6
139.1
15.9
ILE-156
THR-157
6.0
6.3
11.7
-10.0
149.2
151.6
-14.6
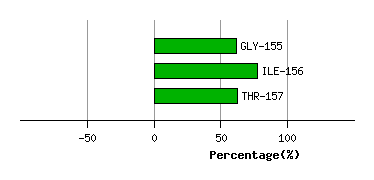
Graph shows rotational transition at bending residues and can be used
to identify hinge bending residues.
Probably only informative for interdomain rotations greater than 20 degrees
Residue
iResidue
i+1Distance of hinge axis to residue i in
(A) Distance of hinge axis to residue i in
(A) Change in
(deg) Change in
(deg) Angle of psi(i) axis to hinge axis
(deg) Angle of psi(i) axis to hinge axis
(deg) Percentage Progress
ASN-244
VAL-245
17.3
17.4
-3.1
-20.2
55.1
52.7
93.5
VAL-245
SER-246
17.7
17.4
44.2
-6.4
81.9
103.1
25.4
SER-246
VAL-247
21.3
21.2
37.6
-26.6
32.3
72.1
94.9
VAL-247
SER-248
21.9
23.2
31.0
-53.4
50.6
51.0
-73.9
SER-248
GLU-249
25.0
25.2
7.4
-19.0
32.1
29.7
-123.7
GLU-249
ALA-250
24.6
24.7
9.6
-5.9
86.9
73.6
31.8
ALA-250
ALA-251
26.9
26.7
10.9
-7.8
118.0
114.1
15.7
ALA-251
ILE-252
24.6
24.4
3.7
5.3
56.7
56.2
39.1
ILE-252
GLU-253
21.6
21.4
1.0
-16.0
39.8
33.5
-89.6
GLU-253
ALA-254
23.7
23.2
7.7
-2.9
111.2
100.7
-3.7
ALA-254
SER-255
25.1
24.8
2.7
1.6
104.1
102.7
-25.1
SER-255
THR-256
21.6
21.5
16.9
-10.5
39.0
35.8
46.8
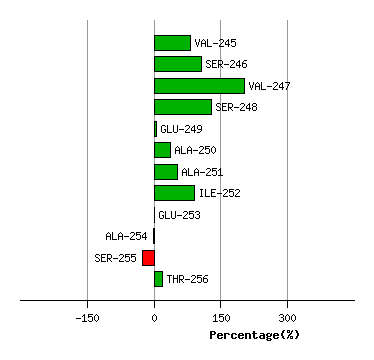
Graph shows rotational transition at bending residues and can be used
to identify hinge bending residues.
Probably only informative for interdomain rotations greater than 20 degrees
Residue
iResidue
i+1Distance of hinge axis to residue i in
(A) Distance of hinge axis to residue i in
(A) Change in
(deg) Change in
(deg) Angle of psi(i) axis to hinge axis
(deg) Angle of psi(i) axis to hinge axis
(deg) Percentage Progress
THR-265
VAL-266
14.7
15.1
-13.2
10.9
78.9
80.6
59.4
VAL-266
LEU-267
12.3
12.7
-2.8
8.1
79.2
77.4
-36.7
LEU-267
VAL-268
13.8
14.4
-12.9
5.0
50.8
48.6
109.5
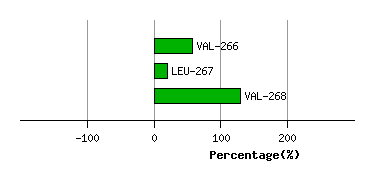
Graph shows rotational transition at bending residues and can be used
to identify hinge bending residues.
Probably only informative for interdomain rotations greater than 20 degrees
Residue
iResidue
i+1Distance of hinge axis to residue i in
(A) Distance of hinge axis to residue i in
(A) Change in
(deg) Change in
(deg) Angle of psi(i) axis to hinge axis
(deg) Angle of psi(i) axis to hinge axis
(deg) Percentage Progress
CYS-276
CYS-277
20.2
20.0
10.8
0.0
151.2
153.8
-57.3
CYS-277
SER-278
22.2
22.0
0.3
19.9
86.1
87.0
-55.8
SER-278
ASP-279
21.8
20.6
-33.3
6.9
26.0
26.8
207.4
ASP-279
VAL-280
22.4
22.3
-4.9
6.9
81.3
66.9
-48.9
VAL-280
PHE-281
19.1
19.5
-5.1
-6.8
76.8
78.6
3.5
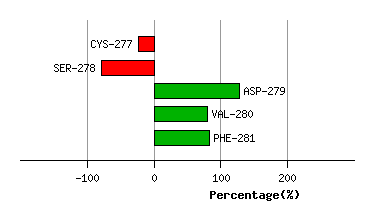
Graph shows rotational transition at bending residues and can be used
to identify hinge bending residues.
Probably only informative for interdomain rotations greater than 20 degrees
Residue
iResidue
i+1Distance of hinge axis to residue i in
(A) Distance of hinge axis to residue i in
(A) Change in
(deg) Change in
(deg) Angle of psi(i) axis to hinge axis
(deg) Angle of psi(i) axis to hinge axis
(deg) Percentage Progress
SER-293
TYR-294
8.5
9.1
-14.4
19.5
63.7
55.9
-52.6
TYR-294
VAL-295
9.5
9.8
-31.7
11.7
29.3
30.3
150.7
VAL-295
GLY-296
8.8
9.2
-2.5
11.1
91.8
95.4
4.5
GLY-296
ASN-297
5.4
5.7
1.5
4.5
86.6
84.4
45.6
GLY-296
ASN-297
5.4
5.7
1.5
4.5
86.6
84.4
45.6
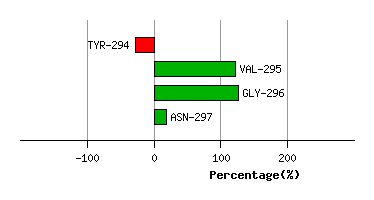
Graph shows rotational transition at bending residues and can be used
to identify hinge bending residues.
Probably only informative for interdomain rotations greater than 20 degrees
Residue
iResidue
i+1Distance of hinge axis to residue i in
(A) Distance of hinge axis to residue i in
(A) Change in
(deg) Change in
(deg) Angle of psi(i) axis to hinge axis
(deg) Angle of psi(i) axis to hinge axis
(deg) Percentage Progress
GLY-296
ASN-297
5.4
5.7
1.5
4.5
86.6
84.4
45.6
GLY-296
ASN-297
5.4
5.7
1.5
4.5
86.6
84.4
45.6
ASN-297
ARG-298
5.8
6.2
7.3
-5.7
24.9
24.1
10.7
ARG-298
ALA-299
7.1
7.1
12.2
-7.4
70.2
75.1
20.9
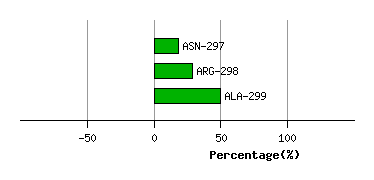
Graph shows rotational transition at bending residues and can be used
to identify hinge bending residues.
Probably only informative for interdomain rotations greater than 20 degrees
Residue
iResidue
i+1Distance of hinge axis to residue i in
(A) Distance of hinge axis to residue i in
(A) Change in
(deg) Change in
(deg) Angle of psi(i) axis to hinge axis
(deg) Angle of psi(i) axis to hinge axis
(deg) Percentage Progress
LEU-312
VAL-313
9.2
9.1
-13.8
3.1
115.4
111.6
-19.2
VAL-313
LYS-314
8.9
9.3
17.4
-17.4
134.5
137.1
17.5
LYS-314
SER-315
10.6
10.8
-48.3
59.9
112.7
111.4
58.9
SER-315
PRO-316
13.1
13.1
20.4
-2.9
141.3
134.0
-109.8
PRO-316
ILE-317
15.9
16.5
-10.9
7.8
104.7
90.6
-7.5
ILE-317
LYS-318
16.9
17.0
-14.9
-0.2
45.9
45.5
63.0
LYS-318
VAL-319
19.8
19.9
-3.4
5.5
88.6
89.6
5.8
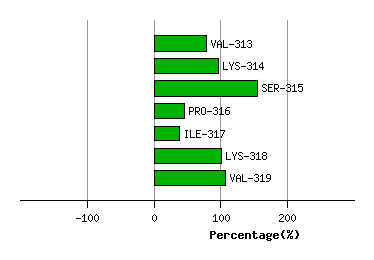
Graph shows rotational transition at bending residues and can be used
to identify hinge bending residues.
Probably only informative for interdomain rotations greater than 20 degrees