Beta-Amylase
(All numbering and residues are taken from first PDB file)
![]()
![]()
Bending Residue Dihedral Analysis
Residue
iResidue
i+1Distance of hinge axis to residue i in
(A) Distance of hinge axis to residue i in
(A) Change in
(deg) Change in
(deg) Angle of psi(i) axis to hinge axis
(deg) Angle of psi(i) axis to hinge axis
(deg) Percentage Progress
ALA-17
PRO-18
11.7
11.8
-4.7
4.2
86.8
85.5
49.9
PRO-18
LEU-19
15.4
15.5
-1.5
3.2
46.1
45.2
-46.4
LEU-19
LYS-20
18.0
18.0
-0.5
-6.8
117.0
113.3
-159.5
LYS-20
LYS-21
19.8
19.9
5.6
5.8
70.2
64.2
306.0
LYS-21
ILE-22
18.6
18.8
-2.0
1.1
152.4
148.3
49.0
ILE-22
PRO-23
16.2
16.3
-1.2
1.8
142.4
145.4
29.5
PRO-23
GLU-24
18.9
18.9
-6.8
11.3
94.2
92.7
-118.0
GLU-24
VAL-25
21.1
21.1
-4.2
-1.2
103.6
102.8
-181.3
VAL-25
THR-26
18.6
18.7
5.7
2.4
25.4
29.5
476.3
THR-26
ASN-27
16.5
16.4
1.8
-10.6
83.0
81.7
-24.4
ASN-27
TRP-28
15.5
15.6
-6.7
8.4
67.0
70.1
26.7
TRP-28
GLU-29
13.4
13.7
-7.6
-0.2
120.3
120.8
-239.6
GLU-29
THR-30
10.9
11.3
2.0
-1.4
98.2
94.2
146.8
THR-30
PHE-31
10.3
10.4
0.3
3.2
159.3
157.4
-212.9
PHE-31
GLU-32
10.0
10.1
6.7
-4.0
95.0
96.0
-4.1
GLU-32
ASN-33
7.4
7.5
-1.5
1.5
67.5
68.1
-1.1
GLU-32
ASN-33
7.4
7.5
-1.5
1.5
67.5
68.1
-1.1
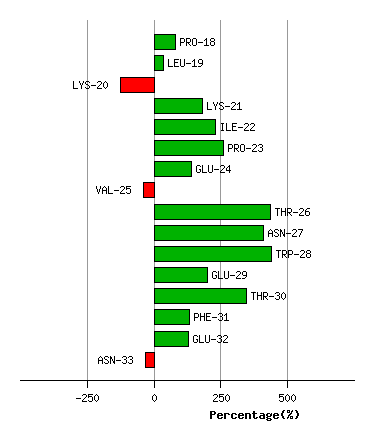
Graph shows rotational transition at bending residues and can be used
to identify hinge bending residues.
Probably only informative for interdomain rotations greater than 20 degrees
Residue
iResidue
i+1Distance of hinge axis to residue i in
(A) Distance of hinge axis to residue i in
(A) Change in
(deg) Change in
(deg) Angle of psi(i) axis to hinge axis
(deg) Angle of psi(i) axis to hinge axis
(deg) Percentage Progress
GLU-32
ASN-33
7.4
7.5
-1.5
1.5
67.5
68.1
-1.1
GLU-32
ASN-33
7.4
7.5
-1.5
1.5
67.5
68.1
-1.1
ASN-33
ASP-34
5.5
5.5
1.2
0.9
52.8
52.0
87.0
ASP-34
LEU-35
7.0
6.9
-8.1
11.1
136.7
136.0
89.8
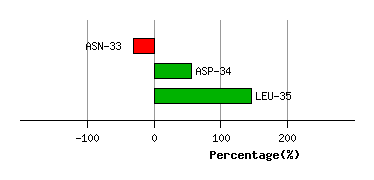
Graph shows rotational transition at bending residues and can be used
to identify hinge bending residues.
Probably only informative for interdomain rotations greater than 20 degrees
Residue
iResidue
i+1Distance of hinge axis to residue i in
(A) Distance of hinge axis to residue i in
(A) Change in
(deg) Change in
(deg) Angle of psi(i) axis to hinge axis
(deg) Angle of psi(i) axis to hinge axis
(deg) Percentage Progress
ALA-45
ILE-46
2.0
2.1
2.1
-0.6
89.5
90.7
45.6
ILE-46
THR-47
5.7
5.8
6.4
-1.1
141.5
142.8
-235.2
THR-47
VAL-48
7.8
7.9
5.3
-3.1
73.4
70.7
114.3
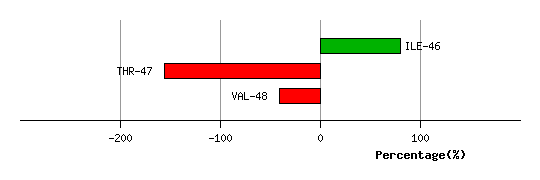
Graph shows rotational transition at bending residues and can be used
to identify hinge bending residues.
Probably only informative for interdomain rotations greater than 20 degrees
Residue
iResidue
i+1Distance of hinge axis to residue i in
(A) Distance of hinge axis to residue i in
(A) Change in
(deg) Change in
(deg) Angle of psi(i) axis to hinge axis
(deg) Angle of psi(i) axis to hinge axis
(deg) Percentage Progress
ALA-78
GLY-79
5.6
5.7
3.7
-6.6
63.1
63.6
-55.5
GLY-79
MET-80
5.9
6.2
1.4
2.0
39.7
42.9
239.6
MET-80
LYS-81
4.0
4.1
-1.6
0.8
148.3
152.6
74.3
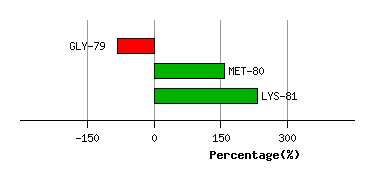
Graph shows rotational transition at bending residues and can be used
to identify hinge bending residues.
Probably only informative for interdomain rotations greater than 20 degrees
Residue
iResidue
i+1Distance of hinge axis to residue i in
(A) Distance of hinge axis to residue i in
(A) Change in
(deg) Change in
(deg) Angle of psi(i) axis to hinge axis
(deg) Angle of psi(i) axis to hinge axis
(deg) Percentage Progress
MET-82
ILE-83
6.3
6.2
-2.4
2.3
2.7
5.6
56.5
ILE-83
PRO-84
6.6
6.7
-1.4
5.6
82.4
81.7
-157.3
PRO-84
ILE-85
10.3
10.4
-0.6
-2.4
28.8
30.2
187.6
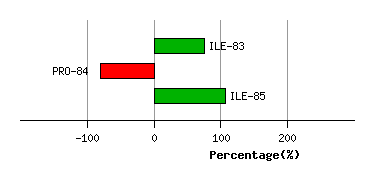
Graph shows rotational transition at bending residues and can be used
to identify hinge bending residues.
Probably only informative for interdomain rotations greater than 20 degrees
Residue
iResidue
i+1Distance of hinge axis to residue i in
(A) Distance of hinge axis to residue i in
(A) Change in
(deg) Change in
(deg) Angle of psi(i) axis to hinge axis
(deg) Angle of psi(i) axis to hinge axis
(deg) Percentage Progress
LYS-157
ASP-158
13.5
13.5
-7.7
12.6
69.5
66.7
-154.4
ASP-158
VAL-159
12.1
12.1
-10.0
3.8
71.3
78.0
119.1
VAL-159
ILE-160
9.1
9.1
-0.7
-0.6
138.2
141.1
-137.0
ILE-160
ALA-161
8.6
8.7
5.2
-4.6
57.0
57.3
89.7
ALA-161
LYS-162
5.6
5.6
-4.7
2.6
160.3
162.0
-108.1
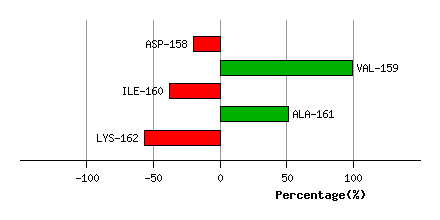
Graph shows rotational transition at bending residues and can be used
to identify hinge bending residues.
Probably only informative for interdomain rotations greater than 20 degrees
Residue
iResidue
i+1Distance of hinge axis to residue i in
(A) Distance of hinge axis to residue i in
(A) Change in
(deg) Change in
(deg) Angle of psi(i) axis to hinge axis
(deg) Angle of psi(i) axis to hinge axis
(deg) Percentage Progress
ALA-323
LYS-324
6.4
6.4
7.5
-6.2
141.7
143.3
-150.6
LYS-324
LEU-325
4.6
4.7
-5.1
3.4
28.8
31.0
169.7
LEU-325
ASP-326
4.1
4.2
-3.5
1.8
75.5
76.1
-62.2
ASP-326
VAL-327
2.2
2.2
-1.9
1.2
90.0
89.7
30.0
VAL-327
THR-328
5.6
5.6
-0.1
-4.8
35.9
35.5
250.4
THR-328
PHE-329
8.1
8.0
-8.6
23.3
108.5
107.8
255.0
PHE-329
THR-330
11.6
11.5
-35.9
33.1
33.5
27.9
327.1
THR-330
CYS-331
14.5
13.9
-157.9
130.2
81.9
104.9
32.8
THR-330
CYS-331
14.5
13.9
-157.9
130.2
81.9
104.9
32.8
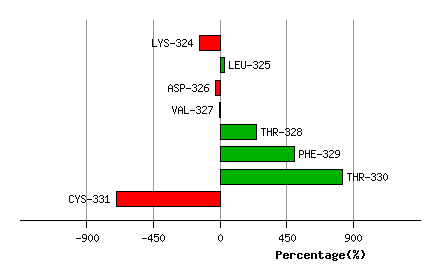
Graph shows rotational transition at bending residues and can be used
to identify hinge bending residues.
Probably only informative for interdomain rotations greater than 20 degrees
Residue
iResidue
i+1Distance of hinge axis to residue i in
(A) Distance of hinge axis to residue i in
(A) Change in
(deg) Change in
(deg) Angle of psi(i) axis to hinge axis
(deg) Angle of psi(i) axis to hinge axis
(deg) Percentage Progress
THR-330
CYS-331
14.5
13.9
-157.9
130.2
81.9
104.9
32.8
THR-330
CYS-331
14.5
13.9
-157.9
130.2
81.9
104.9
32.8
CYS-331
LEU-332
17.9
16.8
68.0
-49.4
79.7
92.0
283.1
LEU-332
GLU-333
16.8
16.7
7.1
0.8
49.3
52.6
593.6
GLU-333
MET-334
19.3
19.3
16.4
-12.3
110.3
105.6
-45.5
MET-334
THR-335
22.3
22.4
-3.2
15.4
55.6
55.6
-463.4
THR-335
ASP-336
24.8
25.2
-11.7
6.3
42.4
36.2
398.1
ASP-336
LYS-337
26.7
26.6
-10.1
13.2
101.6
100.1
115.6
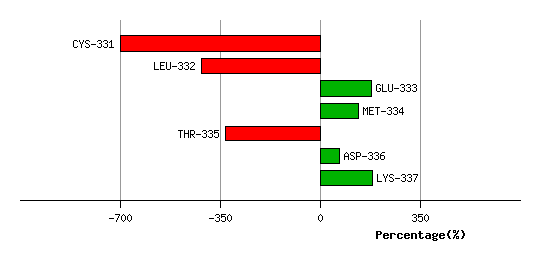
Graph shows rotational transition at bending residues and can be used
to identify hinge bending residues.
Probably only informative for interdomain rotations greater than 20 degrees
Residue
iResidue
i+1Distance of hinge axis to residue i in
(A) Distance of hinge axis to residue i in
(A) Change in
(deg) Change in
(deg) Angle of psi(i) axis to hinge axis
(deg) Angle of psi(i) axis to hinge axis
(deg) Percentage Progress
ALA-354
THR-355
12.4
12.4
5.7
-3.7
45.2
45.9
139.3
THR-355
LEU-356
13.7
13.6
-0.1
-0.5
129.1
129.8
41.9
LEU-356
ALA-357
11.0
10.9
2.3
-1.1
114.0
115.1
49.2
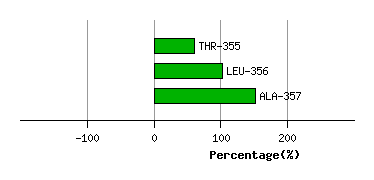
Graph shows rotational transition at bending residues and can be used
to identify hinge bending residues.
Probably only informative for interdomain rotations greater than 20 degrees
Residue
iResidue
i+1Distance of hinge axis to residue i in
(A) Distance of hinge axis to residue i in
(A) Change in
(deg) Change in
(deg) Angle of psi(i) axis to hinge axis
(deg) Angle of psi(i) axis to hinge axis
(deg) Percentage Progress
ALA-391
GLY-392
7.1
7.1
1.9
-4.1
32.5
32.6
-107.0
GLY-392
PHE-393
6.4
6.5
1.2
-1.5
85.4
85.5
-62.1
PHE-393
THR-394
8.6
8.7
1.7
-1.6
47.8
47.4
-37.1
THR-394
LEU-395
8.6
8.8
3.4
0.0
69.4
68.8
125.2
LEU-395
LEU-396
11.5
11.6
-3.7
8.9
102.6
101.0
230.1
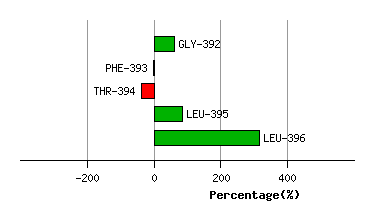
Graph shows rotational transition at bending residues and can be used
to identify hinge bending residues.
Probably only informative for interdomain rotations greater than 20 degrees