Phosphoglycerate Kinase
(All numbering and residues are taken from first PDB file)
![]()
![]()
Bending Residue Dihedral Analysis
Residue
iResidue
i+1Distance of hinge axis to residue i in
(A) Distance of hinge axis to residue i in
(A) Change in
(deg) Change in
(deg) Angle of psi(i) axis to hinge axis
(deg) Angle of psi(i) axis to hinge axis
(deg) Percentage Progress
LYS-192
TYR-193
8.6
6.6
6.7
-3.0
131.9
132.1
-15.5
TYR-193
PHE-194
7.2
5.0
-5.6
9.7
115.6
110.5
-12.1
PHE-194
GLY-195
5.9
4.3
20.0
-5.0
47.0
56.0
38.1
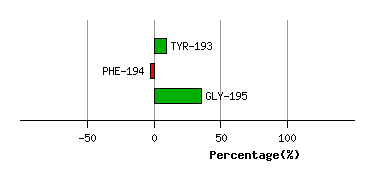
Graph shows rotational transition at bending residues and can be used
to identify hinge bending residues.
Probably only informative for interdomain rotations greater than 20 degrees
Residue
iResidue
i+1Distance of hinge axis to residue i in
(A) Distance of hinge axis to residue i in
(A) Change in
(deg) Change in
(deg) Angle of psi(i) axis to hinge axis
(deg) Angle of psi(i) axis to hinge axis
(deg) Percentage Progress
ILE-386
SER-387
4.3
2.3
86.4
139.9
144.7
126.0
383.3
SER-387
HIS-388
4.3
3.8
91.3
-33.9
122.9
130.8
-92.0
HIS-388
VAL-389
1.7
0.9
12.5
-15.2
82.0
88.1
21.4
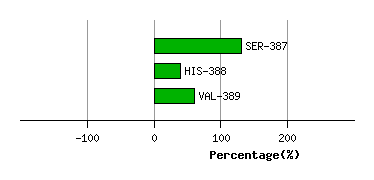
Graph shows rotational transition at bending residues and can be used
to identify hinge bending residues.
Probably only informative for interdomain rotations greater than 20 degrees
Residue
iResidue
i+1Distance of hinge axis to residue i in
(A) Distance of hinge axis to residue i in
(A) Change in
(deg) Change in
(deg) Angle of psi(i) axis to hinge axis
(deg) Angle of psi(i) axis to hinge axis
(deg) Percentage Progress
GLY-392
GLY-393
7.5
7.9
6.6
-15.6
105.4
95.3
32.1
GLY-393
GLY-394
9.0
9.5
-7.1
6.2
136.6
141.8
3.6
GLY-394
ALA-395
10.4
10.6
14.5
-5.1
48.6
57.6
16.1
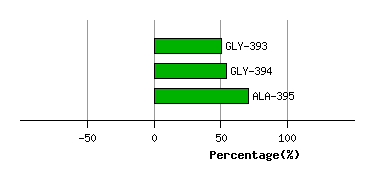
Graph shows rotational transition at bending residues and can be used
to identify hinge bending residues.
Probably only informative for interdomain rotations greater than 20 degrees
Residue
iResidue
i+1Distance of hinge axis to residue i in
(A) Distance of hinge axis to residue i in
(A) Change in
(deg) Change in
(deg) Angle of psi(i) axis to hinge axis
(deg) Angle of psi(i) axis to hinge axis
(deg) Percentage Progress
LEU-400
GLU-401
6.7
8.5
18.4
-13.9
120.0
131.1
41.1
GLU-401
GLY-402
9.7
10.8
33.7
-31.6
130.8
127.5
-19.2
GLY-402
LYS-403
8.7
9.6
-23.9
-28.6
24.2
29.1
131.7
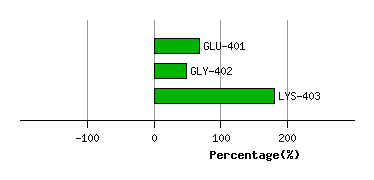
Graph shows rotational transition at bending residues and can be used
to identify hinge bending residues.
Probably only informative for interdomain rotations greater than 20 degrees