D-Glyceraldehyde-3-Phosphate Dehydrogenase 4 (E.C.1.2.1.12)
(All numbering and residues are taken from first PDB file)
![]()
![]()
Bending Residue Dihedral Analysis
Residue
iResidue
i+1Distance of hinge axis to residue i in
(A) Distance of hinge axis to residue i in
(A) Change in
(deg) Change in
(deg) Angle of psi(i) axis to hinge axis
(deg) Angle of psi(i) axis to hinge axis
(deg) Percentage Progress
VAL-30
ASN-31
11.1
11.0
-5.5
12.4
90.4
91.8
-75.1
ASN-31
ASP-32
14.5
14.5
-15.4
-5.3
65.0
72.2
239.9
ASP-32
LEU-33
16.1
16.0
-53.2
32.8
103.6
120.4
-264.4
LEU-33
THR-34
19.7
19.6
-39.0
70.8
143.0
122.3
431.7
THR-34
ASP-36
19.2
18.6
-47.2
35.0
145.6
161.8
-269.9
ASP-36
ALA-37
18.0
18.5
-4.0
-4.5
95.1
98.4
37.9
ALA-37
ASN-38
14.6
15.1
8.0
-3.1
74.5
74.5
88.9
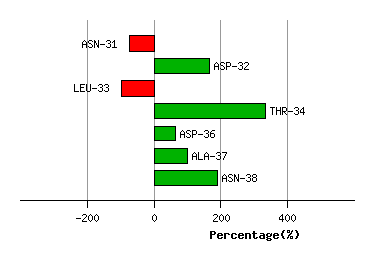
Graph shows rotational transition at bending residues and can be used
to identify hinge bending residues.
Probably only informative for interdomain rotations greater than 20 degrees
Residue
iResidue
i+1Distance of hinge axis to residue i in
(A) Distance of hinge axis to residue i in
(A) Change in
(deg) Change in
(deg) Angle of psi(i) axis to hinge axis
(deg) Angle of psi(i) axis to hinge axis
(deg) Percentage Progress
GLY-68
LYS-69
1.5
1.6
2.5
-7.9
60.3
63.6
-12.3
LYS-69
GLU-70
4.2
4.3
-15.3
8.6
98.4
101.1
-5.1
GLU-70
ILE-71
7.0
7.1
-13.5
21.0
160.9
154.8
131.7
ILE-71
ILE-72
8.1
8.1
-13.0
14.4
85.7
89.4
-50.3
ILE-72
VAL-73
11.9
11.9
3.0
-8.8
51.2
43.4
-94.8
VAL-73
LYS-74
13.6
13.5
-25.7
27.2
97.9
97.1
73.3
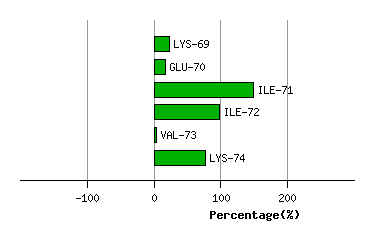
Graph shows rotational transition at bending residues and can be used
to identify hinge bending residues.
Probably only informative for interdomain rotations greater than 20 degrees
Residue
iResidue
i+1Distance of hinge axis to residue i in
(A) Distance of hinge axis to residue i in
(A) Change in
(deg) Change in
(deg) Angle of psi(i) axis to hinge axis
(deg) Angle of psi(i) axis to hinge axis
(deg) Percentage Progress
SER-145
ASN-146
8.4
8.2
-0.1
-1.0
90.0
91.2
-18.9
ASN-146
ALA-147
4.6
4.4
-4.2
0.2
50.9
51.0
25.9
ALA-147
SER-148
4.9
4.5
7.4
-11.2
61.8
59.8
-11.6
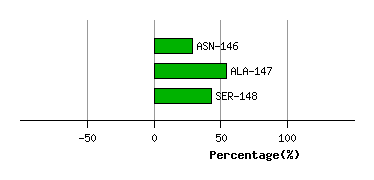
Graph shows rotational transition at bending residues and can be used
to identify hinge bending residues.
Probably only informative for interdomain rotations greater than 20 degrees
Residue
iResidue
i+1Distance of hinge axis to residue i in
(A) Distance of hinge axis to residue i in
(A) Change in
(deg) Change in
(deg) Angle of psi(i) axis to hinge axis
(deg) Angle of psi(i) axis to hinge axis
(deg) Percentage Progress
VAL-214
ALA-215
1.3
1.2
2.1
-6.0
59.2
57.4
139.4
ALA-215
LEU-216
3.2
3.3
6.9
3.7
124.3
126.2
-182.9
LEU-216
VAL-217
5.7
5.7
-2.1
6.2
68.9
70.0
108.5
VAL-217
LEU-218
4.9
4.7
-22.2
16.5
130.1
135.5
-145.3
LEU-218
PRO-219
4.9
4.8
7.5
-6.2
34.1
36.7
-42.7
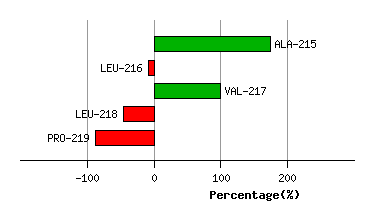
Graph shows rotational transition at bending residues and can be used
to identify hinge bending residues.
Probably only informative for interdomain rotations greater than 20 degrees
Residue
iResidue
i+1Distance of hinge axis to residue i in
(A) Distance of hinge axis to residue i in
(A) Change in
(deg) Change in
(deg) Angle of psi(i) axis to hinge axis
(deg) Angle of psi(i) axis to hinge axis
(deg) Percentage Progress
HIS-319
ARG-320
3.3
3.5
3.0
5.5
48.6
50.1
114.6
ARG-320
VAL-321
2.4
2.6
-11.0
1.9
73.3
73.3
-37.4
VAL-321
VAL-322
2.1
2.2
6.2
-1.4
131.5
134.3
7.0
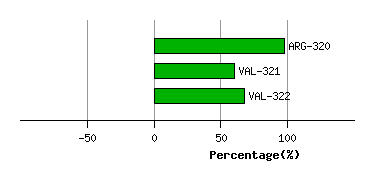
Graph shows rotational transition at bending residues and can be used
to identify hinge bending residues.
Probably only informative for interdomain rotations greater than 20 degrees