Glycoprotein G
(All numbering and residues are taken from first PDB file)
![]()
![]()
Bending Residue Dihedral Analysis
Residue
iResidue
i+1Distance of hinge axis to residue i in
(A) Distance of hinge axis to residue i in
(A) Change in
(deg) Change in
(deg) Angle of psi(i) axis to hinge axis
(deg) Angle of psi(i) axis to hinge axis
(deg) Percentage Progress
PHE-2
THR-3
5.2
5.4
-46.8
17.1
133.4
145.1
182.0
THR-3
ILE-4
6.1
6.2
5.8
-7.5
78.0
80.0
0.4
ILE-4
VAL-5
8.2
8.5
-8.7
8.1
141.8
145.0
-0.4
VAL-5
PHE-6
10.9
11.1
-4.9
1.4
63.8
66.1
-203.4
PHE-6
PRO-7
14.6
14.8
-2.3
-5.6
130.0
131.5
200.6
PRO-7
HIS-8
18.0
18.1
23.8
15.7
94.9
105.6
-10.9
HIS-8
ASN-9
19.4
20.2
161.2
3.6
104.9
132.0
-83.3
ASN-9
GLN-10
22.8
22.6
-50.6
-43.0
7.2
116.8
20.8
GLN-10
LYS-11
24.2
25.6
-173.4
31.9
79.6
65.9
66.7
LYS-11
GLY-12
27.1
28.3
7.0
0.2
48.0
46.8
1.2
GLY-12
ASN-13
27.0
27.6
-2.6
29.0
106.4
110.3
3.0
ASN-13
TRP-14
29.7
29.9
-17.5
13.5
96.0
73.3
3.9
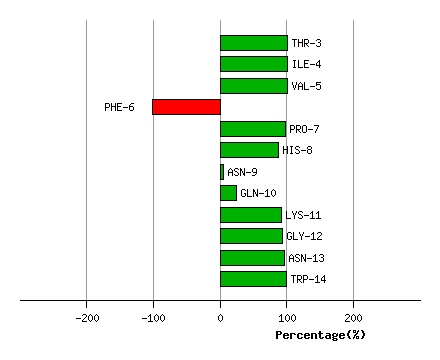
Graph shows rotational transition at bending residues and can be used
to identify hinge bending residues.
Probably only informative for interdomain rotations greater than 20 degrees
Residue
iResidue
i+1Distance of hinge axis to residue i in
(A) Distance of hinge axis to residue i in
(A) Change in
(deg) Change in
(deg) Angle of psi(i) axis to hinge axis
(deg) Angle of psi(i) axis to hinge axis
(deg) Percentage Progress
SER-19
ASN-20
33.0
32.8
178.9
-167.1
136.4
131.4
1.0
ASN-20
TYR-21
30.8
30.9
7.7
-24.7
86.8
91.4
-2.8
TYR-21
HIS-22
27.7
27.5
-3.1
8.1
125.8
141.3
1.6
HIS-22
TYR-23
25.1
25.4
-6.9
31.8
72.8
79.3
-2.7
TYR-23
CYS-24
21.7
21.9
18.9
-11.9
47.7
52.4
5.8
CYS-24
PRO-25
18.7
19.0
-17.1
34.2
74.1
71.6
-5.4
PRO-25
SER-26
15.0
15.4
161.3
13.3
111.3
131.7
-102.0
SER-26
SER-27
12.1
14.7
-142.9
-11.3
138.3
24.1
16.4
SER-27
SER-28
9.8
16.6
-167.1
-30.1
85.3
53.6
-101.7
SER-28
ASP-29
6.5
13.3
-142.9
7.4
56.4
81.1
90.3
ASP-29
LEU-30
3.5
11.7
97.7
-11.4
58.4
156.3
36.8
LEU-30
ASN-31
1.3
11.0
21.0
64.0
101.1
93.9
36.0
ASN-31
TRP-32
2.8
12.2
-47.5
-72.6
26.8
80.3
-113.9
TRP-32
HIS-33
3.3
15.7
35.8
-69.0
116.7
109.5
1.8
HIS-33
ASN-34
4.2
15.8
79.2
-175.9
67.7
135.7
30.3
ASN-34
ASP-35
7.0
14.2
-75.9
23.3
108.2
41.4
9.2
ASP-35
LEU-36
10.0
15.9
-8.9
-36.0
48.4
52.6
21.5
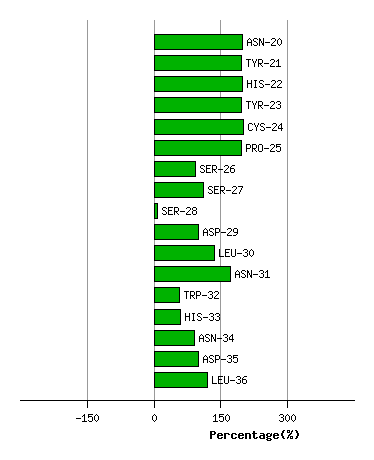
Graph shows rotational transition at bending residues and can be used
to identify hinge bending residues.
Probably only informative for interdomain rotations greater than 20 degrees
Residue
iResidue
i+1Distance of hinge axis to residue i in
(A) Distance of hinge axis to residue i in
(A) Change in
(deg) Change in
(deg) Angle of psi(i) axis to hinge axis
(deg) Angle of psi(i) axis to hinge axis
(deg) Percentage Progress
GLN-273
ASP-274
12.0
10.5
-173.7
-3.6
89.9
105.0
91.8
ASP-274
VAL-275
15.4
14.2
-5.4
-1.7
21.6
35.6
5.4
VAL-275
GLU-276
15.7
15.2
4.3
1.9
107.4
103.9
1.8
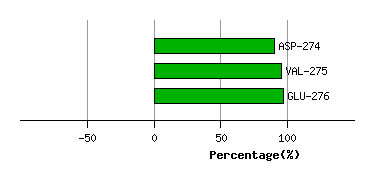
Graph shows rotational transition at bending residues and can be used
to identify hinge bending residues.
Probably only informative for interdomain rotations greater than 20 degrees
Residue
iResidue
i+1Distance of hinge axis to residue i in
(A) Distance of hinge axis to residue i in
(A) Change in
(deg) Change in
(deg) Angle of psi(i) axis to hinge axis
(deg) Angle of psi(i) axis to hinge axis
(deg) Percentage Progress
ILE-297
SER-298
25.8
26.3
18.2
-39.5
55.2
50.4
198.4
SER-298
PRO-299
22.8
23.3
8.0
0.3
123.8
117.1
-4.4
PRO-299
VAL-300
20.1
20.2
1.9
2.8
117.7
112.6
-0.1
VAL-300
ASP-301
17.9
18.5
-2.1
-8.8
35.3
23.0
-197.9
ASP-301
LEU-302
20.7
20.9
-4.9
16.2
41.8
45.9
198.7
LEU-302
SER-303
20.5
20.3
0.7
-2.0
115.5
108.6
-1.1
SER-303
TYR-304
16.7
16.6
7.6
-17.9
134.4
134.4
4.8
TYR-304
LEU-305
16.9
17.2
0.9
-3.4
152.8
153.3
-202.5
LEU-305
ALA-306
18.7
18.8
-3.0
-7.5
69.5
65.9
2.6
ALA-306
PRO-307
16.3
16.4
4.6
5.9
135.2
126.9
200.1
PRO-307
LYS-308
14.2
13.9
3.7
-5.0
63.6
52.7
-201.6
LYS-308
ASN-309
10.5
10.3
-9.5
20.6
57.1
59.8
1.7
ASN-309
PRO-310
9.4
8.8
-6.2
2.0
72.6
74.7
2.3
PRO-310
GLY-311
11.0
10.5
6.0
2.6
143.6
151.0
-4.6
PRO-310
GLY-311
11.0
10.5
6.0
2.6
143.6
151.0
-4.6
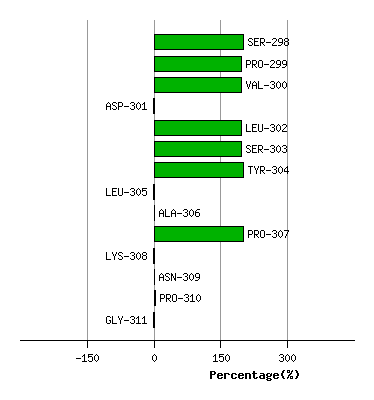
Graph shows rotational transition at bending residues and can be used
to identify hinge bending residues.
Probably only informative for interdomain rotations greater than 20 degrees
Residue
iResidue
i+1Distance of hinge axis to residue i in
(A) Distance of hinge axis to residue i in
(A) Change in
(deg) Change in
(deg) Angle of psi(i) axis to hinge axis
(deg) Angle of psi(i) axis to hinge axis
(deg) Percentage Progress
PRO-310
GLY-311
11.0
10.5
6.0
2.6
143.6
151.0
-4.6
PRO-310
GLY-311
11.0
10.5
6.0
2.6
143.6
151.0
-4.6
GLY-311
THR-312
13.7
12.9
5.6
-18.1
73.8
77.2
200.5
THR-312
GLY-313
17.0
16.3
-9.4
5.2
115.8
110.9
-4.4
GLY-313
PRO-314
17.9
17.8
18.1
-8.0
49.8
50.2
4.0
PRO-314
ALA-315
20.8
20.7
6.9
0.1
22.1
22.9
-200.8
ALA-315
PHE-316
21.1
20.8
10.6
-6.2
64.6
64.9
0.9
PHE-316
THR-317
23.1
22.8
1.4
6.0
19.4
19.6
2.3
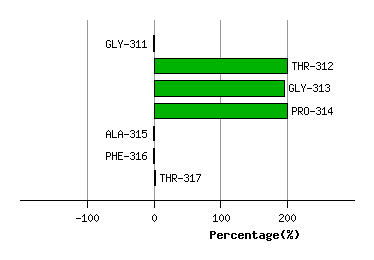
Graph shows rotational transition at bending residues and can be used
to identify hinge bending residues.
Probably only informative for interdomain rotations greater than 20 degrees
Residue
iResidue
i+1Distance of hinge axis to residue i in
(A) Distance of hinge axis to residue i in
(A) Change in
(deg) Change in
(deg) Angle of psi(i) axis to hinge axis
(deg) Angle of psi(i) axis to hinge axis
(deg) Percentage Progress
LYS-324
TYR-325
28.6
28.4
8.8
-15.4
116.0
118.8
-5.7
TYR-325
PHE-326
26.0
26.1
-4.7
5.3
60.7
56.5
201.7
PHE-326
GLU-327
25.6
25.6
3.2
-6.5
116.4
119.9
-202.5
GLU-327
THR-328
23.2
23.2
4.5
-7.0
79.3
82.7
0.3
THR-328
ARG-329
21.2
21.1
10.4
-6.5
112.8
112.7
-0.9
ARG-329
TYR-330
18.1
17.8
7.2
-1.7
36.7
33.4
2.9
TYR-330
ILE-331
15.1
14.9
14.0
-19.9
101.7
98.8
-0.5
ILE-331
ARG-332
13.8
13.4
-1.9
5.5
130.2
136.7
1.1
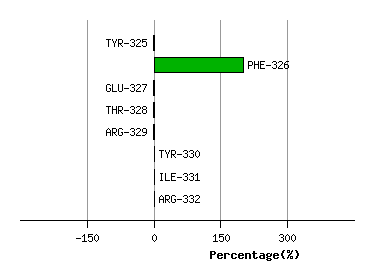
Graph shows rotational transition at bending residues and can be used
to identify hinge bending residues.
Probably only informative for interdomain rotations greater than 20 degrees
Residue
iResidue
i+1Distance of hinge axis to residue i in
(A) Distance of hinge axis to residue i in
(A) Change in
(deg) Change in
(deg) Angle of psi(i) axis to hinge axis
(deg) Angle of psi(i) axis to hinge axis
(deg) Percentage Progress
GLU-355
LEU-356
21.2
21.3
3.8
-9.1
125.0
128.0
0.9
LEU-356
TRP-357
19.3
19.3
5.9
7.9
98.3
93.7
-3.9
TRP-357
ASP-358
22.0
21.9
-9.1
30.5
136.2
131.7
10.2
ASP-358
ASP-359
25.2
25.5
-59.9
19.2
75.5
96.3
-9.7
ASP-359
TRP-360
26.9
27.1
6.7
-0.7
60.6
63.1
3.0
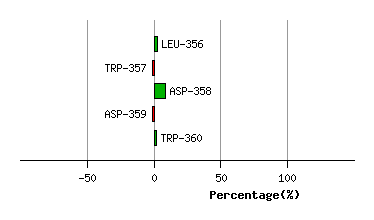
Graph shows rotational transition at bending residues and can be used
to identify hinge bending residues.
Probably only informative for interdomain rotations greater than 20 degrees
Residue
iResidue
i+1Distance of hinge axis to residue i in
(A) Distance of hinge axis to residue i in
(A) Change in
(deg) Change in
(deg) Angle of psi(i) axis to hinge axis
(deg) Angle of psi(i) axis to hinge axis
(deg) Percentage Progress
ALA-361
PRO-362
28.6
28.4
-10.2
-3.2
148.2
150.0
198.2
PRO-362
TYR-363
29.5
29.1
7.3
0.6
104.2
101.0
-0.8
TYR-363
GLU-364
27.4
27.4
11.1
9.1
20.9
22.8
-189.2
GLU-364
ASP-365
28.0
28.2
156.8
-141.9
48.2
53.0
1.8
ASP-365
VAL-366
27.4
27.0
-6.2
3.1
77.2
71.0
-10.2
VAL-366
GLU-367
24.7
24.7
10.2
-8.4
150.7
153.2
-2.2
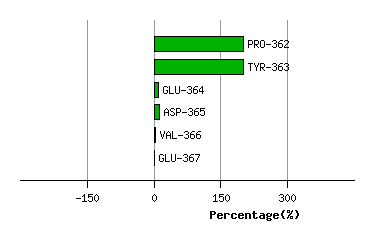
Graph shows rotational transition at bending residues and can be used
to identify hinge bending residues.
Probably only informative for interdomain rotations greater than 20 degrees
Residue
iResidue
i+1Distance of hinge axis to residue i in
(A) Distance of hinge axis to residue i in
(A) Change in
(deg) Change in
(deg) Angle of psi(i) axis to hinge axis
(deg) Angle of psi(i) axis to hinge axis
(deg) Percentage Progress
TYR-380
LYS-381
16.6
16.6
-8.2
11.5
78.0
78.8
1.1
LYS-381
PHE-382
14.7
14.5
-5.3
11.2
19.5
19.8
199.3
PHE-382
PRO-383
13.2
13.0
37.4
3.9
82.7
87.9
-193.5
PRO-383
LEU-384
13.8
13.5
-175.9
-15.9
59.1
82.0
81.5
LEU-384
TYR-385
12.1
10.7
0.8
40.2
71.0
150.6
-24.6
TYR-385
MET-386
8.7
11.6
-30.7
35.5
170.9
49.9
1.1
MET-386
ILE-387
9.5
10.5
-25.9
-5.3
101.7
104.1
0.3
ILE-387
GLY-388
11.6
7.4
161.1
140.9
87.5
106.6
48.0
GLY-388
HIS-389
10.6
6.7
108.1
-0.5
23.3
168.1
-26.9
HIS-389
GLY-390
10.4
7.4
161.7
-161.7
44.2
110.2
-6.3
GLY-390
MET-391
10.6
4.8
123.7
24.4
81.5
77.1
13.1
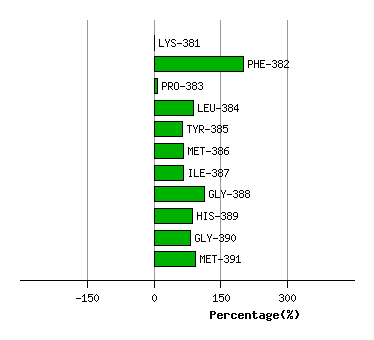
Graph shows rotational transition at bending residues and can be used
to identify hinge bending residues.
Probably only informative for interdomain rotations greater than 20 degrees