Actin Alpha 1
(All numbering and residues are taken from first PDB file)
![]()
![]()
Bending Residue Dihedral Analysis
Residue
iResidue
i+1Distance of hinge axis to residue i in
(A) Distance of hinge axis to residue i in
(A) Change in
(deg) Change in
(deg) Angle of psi(i) axis to hinge axis
(deg) Angle of psi(i) axis to hinge axis
(deg) Percentage Progress
LYS-68
TYR-69
19.6
19.7
6.2
16.6
33.2
33.5
171.5
TYR-69
PRO-70
17.2
17.0
23.6
-11.6
111.3
118.1
-201.7
PRO-70
ILE-71
13.7
13.7
8.5
23.4
60.2
67.3
178.0
ILE-71
GLU-72
11.9
11.9
97.2
-98.8
63.6
83.7
160.9
GLU-72
HIS-73
14.9
13.0
154.4
-177.8
56.9
69.3
-79.5
HIS-73
GLY-74
13.5
12.8
-2.0
-4.2
66.4
70.7
-16.0
HIS-73
GLY-74
13.5
12.8
-2.0
-4.2
66.4
70.7
-16.0
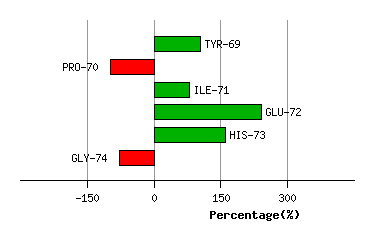
Graph shows rotational transition at bending residues and can be used
to identify hinge bending residues.
Probably only informative for interdomain rotations greater than 20 degrees
Residue
iResidue
i+1Distance of hinge axis to residue i in
(A) Distance of hinge axis to residue i in
(A) Change in
(deg) Change in
(deg) Angle of psi(i) axis to hinge axis
(deg) Angle of psi(i) axis to hinge axis
(deg) Percentage Progress
HIS-73
GLY-74
13.5
12.8
-2.0
-4.2
66.4
70.7
-16.0
HIS-73
GLY-74
13.5
12.8
-2.0
-4.2
66.4
70.7
-16.0
GLY-74
ILE-75
10.2
9.5
1.0
14.9
50.4
43.8
172.9
ILE-75
VAL-76
8.2
7.8
-2.2
2.6
126.0
121.5
-43.3
VAL-76
THR-77
8.2
7.9
10.9
-4.5
19.8
21.8
188.1
THR-77
ASN-78
9.8
10.1
-8.4
-12.1
129.2
134.3
-134.7

Graph shows rotational transition at bending residues and can be used
to identify hinge bending residues.
Probably only informative for interdomain rotations greater than 20 degrees
Residue
iResidue
i+1Distance of hinge axis to residue i in
(A) Distance of hinge axis to residue i in
(A) Change in
(deg) Change in
(deg) Angle of psi(i) axis to hinge axis
(deg) Angle of psi(i) axis to hinge axis
(deg) Percentage Progress
THR-106
GLU-107
3.9
3.3
7.1
-10.4
146.6
148.5
10.8
GLU-107
ALA-108
3.0
2.6
4.7
-1.8
72.7
70.8
1.4
ALA-108
PRO-109
5.7
5.5
-2.8
6.5
86.6
88.9
41.9
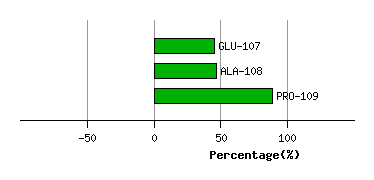
Graph shows rotational transition at bending residues and can be used
to identify hinge bending residues.
Probably only informative for interdomain rotations greater than 20 degrees
Residue
iResidue
i+1Distance of hinge axis to residue i in
(A) Distance of hinge axis to residue i in
(A) Change in
(deg) Change in
(deg) Angle of psi(i) axis to hinge axis
(deg) Angle of psi(i) axis to hinge axis
(deg) Percentage Progress
LEU-110
ASN-111
8.1
7.8
-15.3
20.5
133.7
132.4
61.3
ASN-111
PRO-112
4.9
4.6
-2.4
-13.3
138.1
142.3
-64.6
PRO-112
LYS-113
4.9
4.9
12.5
11.6
91.5
78.1
88.6
LYS-113
ALA-114
4.6
4.5
-18.0
6.6
122.5
114.8
-41.5
ALA-114
ASN-115
2.3
1.7
-8.7
6.6
62.9
53.6
39.1

Graph shows rotational transition at bending residues and can be used
to identify hinge bending residues.
Probably only informative for interdomain rotations greater than 20 degrees
Residue
iResidue
i+1Distance of hinge axis to residue i in
(A) Distance of hinge axis to residue i in
(A) Change in
(deg) Change in
(deg) Angle of psi(i) axis to hinge axis
(deg) Angle of psi(i) axis to hinge axis
(deg) Percentage Progress
GLN-137
ALA-138
3.9
3.4
2.3
3.5
39.3
38.5
13.3
ALA-138
VAL-139
5.9
5.6
3.0
-2.3
54.8
50.5
-4.1
VAL-139
LEU-140
4.1
4.1
-1.6
1.4
130.4
133.4
45.7
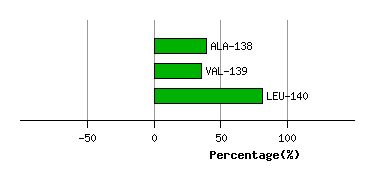
Graph shows rotational transition at bending residues and can be used
to identify hinge bending residues.
Probably only informative for interdomain rotations greater than 20 degrees
Residue
iResidue
i+1Distance of hinge axis to residue i in
(A) Distance of hinge axis to residue i in
(A) Change in
(deg) Change in
(deg) Angle of psi(i) axis to hinge axis
(deg) Angle of psi(i) axis to hinge axis
(deg) Percentage Progress
LYS-336
TYR-337
12.7
12.5
-13.3
17.5
118.5
115.2
-61.4
TYR-337
SER-338
10.3
10.2
-2.9
12.3
79.7
91.0
25.7
SER-338
VAL-339
6.9
6.7
-20.8
1.0
140.0
132.7
-32.4
VAL-339
TRP-340
5.6
5.4
6.7
-8.0
91.7
92.1
112.1
TRP-340
ILE-341
7.4
7.1
12.0
-1.2
142.4
145.4
-121.5
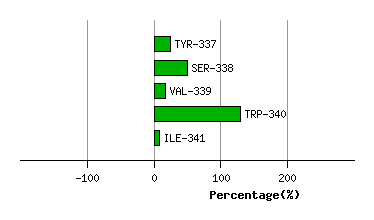
Graph shows rotational transition at bending residues and can be used
to identify hinge bending residues.
Probably only informative for interdomain rotations greater than 20 degrees