DNA Polymerase
(All numbering and residues are taken from first PDB file)
![]()
![]()
Bending Residue Dihedral Analysis
Residue
iResidue
i+1Distance of hinge axis to residue i in
(A) Distance of hinge axis to residue i in
(A) Change in
(deg) Change in
(deg) Angle of psi(i) axis to hinge axis
(deg) Angle of psi(i) axis to hinge axis
(deg) Percentage Progress
MET-188
THR-189
5.7
6.2
-3.3
8.1
124.0
128.7
70.1
THR-189
ALA-190
7.3
7.8
1.4
4.3
22.6
26.0
90.7
ALA-190
GLY-191
6.5
6.8
-2.3
-0.1
123.2
123.7
11.4
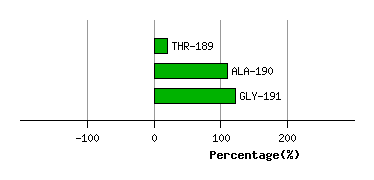
Graph shows rotational transition at bending residues and can be used
to identify hinge bending residues.
Probably only informative for interdomain rotations greater than 20 degrees
Residue
iResidue
i+1Distance of hinge axis to residue i in
(A) Distance of hinge axis to residue i in
(A) Change in
(deg) Change in
(deg) Angle of psi(i) axis to hinge axis
(deg) Angle of psi(i) axis to hinge axis
(deg) Percentage Progress
ILE-364
ASP-365
5.4
5.3
-7.8
2.1
53.9
56.0
40.6
ASP-365
LYS-366
3.4
3.3
4.5
-7.3
54.3
55.9
-70.1
LYS-366
TRP-367
3.2
3.3
5.6
3.5
62.2
60.6
93.4
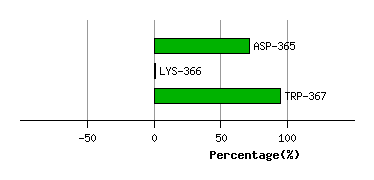
Graph shows rotational transition at bending residues and can be used
to identify hinge bending residues.
Probably only informative for interdomain rotations greater than 20 degrees
Residue
iResidue
i+1Distance of hinge axis to residue i in
(A) Distance of hinge axis to residue i in
(A) Change in
(deg) Change in
(deg) Angle of psi(i) axis to hinge axis
(deg) Angle of psi(i) axis to hinge axis
(deg) Percentage Progress
ALA-382
LYS-383
3.8
3.8
7.3
-1.2
80.2
77.5
42.4
LYS-383
LEU-384
6.9
6.8
-11.3
9.4
46.3
45.8
29.2
LEU-384
MET-385
6.7
6.8
5.3
-6.2
78.8
82.9
-25.3
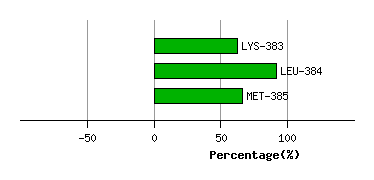
Graph shows rotational transition at bending residues and can be used
to identify hinge bending residues.
Probably only informative for interdomain rotations greater than 20 degrees
Residue
iResidue
i+1Distance of hinge axis to residue i in
(A) Distance of hinge axis to residue i in
(A) Change in
(deg) Change in
(deg) Angle of psi(i) axis to hinge axis
(deg) Angle of psi(i) axis to hinge axis
(deg) Percentage Progress
LEU-389
TYR-390
10.6
10.3
0.2
2.9
95.5
94.1
64.3
TYR-390
GLY-391
14.0
13.7
2.8
0.7
29.4
30.0
50.9
GLY-391
LYS-392
15.1
14.6
-17.3
13.0
121.6
118.4
-80.1
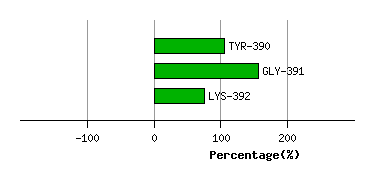
Graph shows rotational transition at bending residues and can be used
to identify hinge bending residues.
Probably only informative for interdomain rotations greater than 20 degrees
Residue
iResidue
i+1Distance of hinge axis to residue i in
(A) Distance of hinge axis to residue i in
(A) Change in
(deg) Change in
(deg) Angle of psi(i) axis to hinge axis
(deg) Angle of psi(i) axis to hinge axis
(deg) Percentage Progress
GLU-419
GLU-420
27.2
26.5
-19.1
38.2
99.8
105.4
124.8
GLU-420
THR-421
24.6
24.1
30.4
-11.2
6.1
1.2
345.9
THR-421
LYS-422
24.3
23.7
-3.0
1.3
105.3
104.2
-27.4
LYS-422
ASP-423
21.8
21.1
-71.9
58.8
147.2
143.7
-184.0
ASP-423
PRO-424
22.1
22.3
4.8
-3.9
36.7
34.8
31.9
PRO-424
VAL-425
21.8
21.4
11.2
-3.5
58.1
66.1
310.1
VAL-425
TYR-426
19.4
19.2
16.5
-9.9
40.9
43.8
-29.8
TYR-426
THR-427
21.4
21.3
-5.0
5.9
110.5
110.1
-15.2
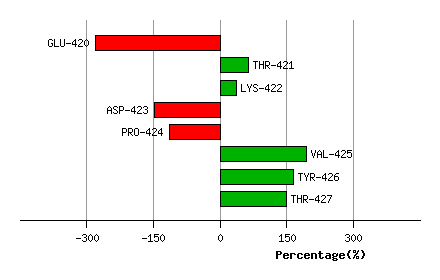
Graph shows rotational transition at bending residues and can be used
to identify hinge bending residues.
Probably only informative for interdomain rotations greater than 20 degrees
Residue
iResidue
i+1Distance of hinge axis to residue i in
(A) Distance of hinge axis to residue i in
(A) Change in
(deg) Change in
(deg) Angle of psi(i) axis to hinge axis
(deg) Angle of psi(i) axis to hinge axis
(deg) Percentage Progress
PRO-558
VAL-559
25.2
25.1
-20.1
23.0
130.9
136.9
48.7
VAL-559
GLN-560
26.3
26.2
7.3
2.2
40.3
39.3
175.7
GLN-560
VAL-561
24.1
24.1
1.0
7.2
33.0
35.4
145.6
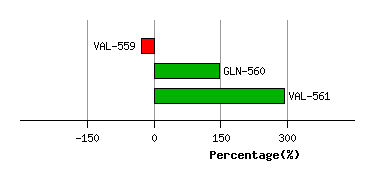
Graph shows rotational transition at bending residues and can be used
to identify hinge bending residues.
Probably only informative for interdomain rotations greater than 20 degrees
Residue
iResidue
i+1Distance of hinge axis to residue i in
(A) Distance of hinge axis to residue i in
(A) Change in
(deg) Change in
(deg) Angle of psi(i) axis to hinge axis
(deg) Angle of psi(i) axis to hinge axis
(deg) Percentage Progress
PRO-562
GLY-563
22.8
22.9
-25.6
10.3
108.8
100.4
-207.0
GLY-563
GLY-564
20.0
19.6
10.8
26.9
25.9
18.5
645.4
GLY-564
VAL-565
19.8
19.7
-4.1
-26.4
131.0
129.2
-365.2
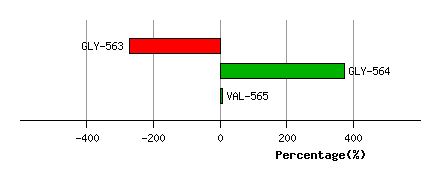
Graph shows rotational transition at bending residues and can be used
to identify hinge bending residues.
Probably only informative for interdomain rotations greater than 20 degrees