Epidermal Growth Factor Receptor
(All numbering and residues are taken from first PDB file)
![]()
![]()
Bending Residue Dihedral Analysis
Residue
iResidue
i+1Distance of hinge axis to residue i in
(A) Distance of hinge axis to residue i in
(A) Change in
(deg) Change in
(deg) Angle of psi(i) axis to hinge axis
(deg) Angle of psi(i) axis to hinge axis
(deg) Percentage Progress
SER-291
TYR-292
5.1
3.7
-2.7
-31.2
79.1
69.2
63.6
TYR-292
GLU-293
3.9
3.2
-2.1
30.7
55.4
76.5
-146.9
GLU-293
MET-294
3.5
4.1
90.1
-64.0
59.1
50.0
82.9
MET-294
GLU-295
5.4
6.6
52.6
-96.9
100.4
113.6
104.2
GLU-295
GLU-296
7.6
10.0
88.9
-179.7
32.5
59.6
-546.4
GLU-296
ASP-297
9.4
13.7
68.9
-65.0
99.6
65.2
-27.7
ASP-297
GLY-298
12.7
14.2
31.2
39.4
158.0
110.3
-557.6
GLY-298
VAL-299
13.4
13.8
-104.0
-28.1
46.0
28.8
876.7
VAL-299
ARG-300
10.6
11.2
19.7
9.6
76.9
77.8
62.4
ARG-300
LYS-301
7.1
7.8
-17.9
18.1
107.0
97.7
50.5
LYS-301
CYS-302
4.7
5.6
-36.9
81.4
108.1
108.4
189.3
CYS-302
LYS-303
1.2
2.2
11.3
-18.1
46.6
16.0
-35.6
CYS-302
LYS-303
1.2
2.2
11.3
-18.1
46.6
16.0
-35.6
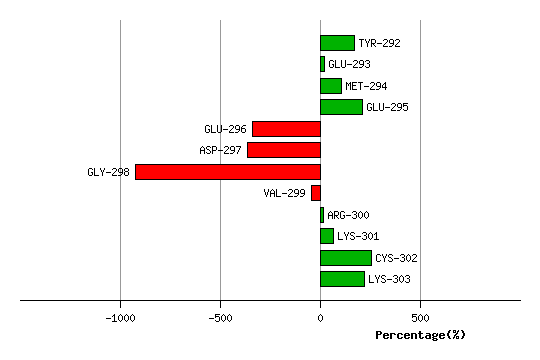
Graph shows rotational transition at bending residues and can be used
to identify hinge bending residues.
Probably only informative for interdomain rotations greater than 20 degrees
Residue
iResidue
i+1Distance of hinge axis to residue i in
(A) Distance of hinge axis to residue i in
(A) Change in
(deg) Change in
(deg) Angle of psi(i) axis to hinge axis
(deg) Angle of psi(i) axis to hinge axis
(deg) Percentage Progress
CYS-302
LYS-303
1.2
2.2
11.3
-18.1
46.6
16.0
-35.6
CYS-302
LYS-303
1.2
2.2
11.3
-18.1
46.6
16.0
-35.6
LYS-303
LYS-304
1.9
1.9
116.9
-124.9
97.9
80.7
-93.1
LYS-304
CYS-305
5.4
3.5
1.7
15.3
51.2
54.7
42.5
GLY-307
PRO-308
13.0
9.8
119.4
-27.5
134.5
116.0
-565.8
PRO-308
CYS-309
13.3
11.2
-105.4
61.1
111.5
21.9
101.7
CYS-309
ARG-310
10.8
9.6
-39.3
-28.6
61.7
53.1
363.5
ARG-310
LYS-311
11.9
11.3
70.2
-104.3
174.3
141.5
295.8
LYS-311
VAL-312
13.1
12.9
5.7
22.0
127.8
144.0
-177.0
VAL-312
CYS-313
10.5
10.4
28.5
-26.6
152.0
139.3
11.2
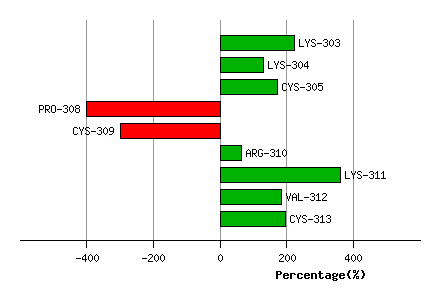
Graph shows rotational transition at bending residues and can be used
to identify hinge bending residues.
Probably only informative for interdomain rotations greater than 20 degrees