Glutamate Receptor, Ionotropic Kainate 1
(All numbering and residues are taken from first PDB file)
![]()
![]()
Bending Residue Dihedral Analysis
Residue
iResidue
i+1Distance of hinge axis to residue i in
(A) Distance of hinge axis to residue i in
(A) Change in
(deg) Change in
(deg) Angle of psi(i) axis to hinge axis
(deg) Angle of psi(i) axis to hinge axis
(deg) Percentage Progress
THR-107
LEU-108
4.7
4.3
26.0
-20.4
49.6
39.5
35.6
LEU-108
GLY-109
2.4
2.2
-8.2
-18.1
68.2
66.1
90.7
GLY-109
ILE-110
3.8
3.9
1.2
9.0
34.7
39.7
13.2

Graph shows rotational transition at bending residues and can be used
to identify hinge bending residues.
Probably only informative for interdomain rotations greater than 20 degrees
Residue
iResidue
i+1Distance of hinge axis to residue i in
(A) Distance of hinge axis to residue i in
(A) Change in
(deg) Change in
(deg) Angle of psi(i) axis to hinge axis
(deg) Angle of psi(i) axis to hinge axis
(deg) Percentage Progress
TYR-114
ARG-115
9.7
10.2
-19.4
-4.0
44.8
27.8
128.7
ARG-115
LYS-116
10.1
10.0
-12.1
20.1
110.2
90.7
18.5
LYS-116
GLY-117
11.2
11.0
-30.5
30.3
67.2
70.4
45.4
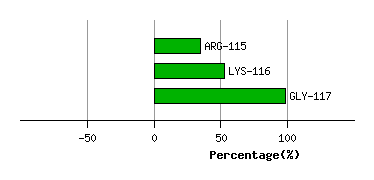
Graph shows rotational transition at bending residues and can be used
to identify hinge bending residues.
Probably only informative for interdomain rotations greater than 20 degrees
Residue
iResidue
i+1Distance of hinge axis to residue i in
(A) Distance of hinge axis to residue i in
(A) Change in
(deg) Change in
(deg) Angle of psi(i) axis to hinge axis
(deg) Angle of psi(i) axis to hinge axis
(deg) Percentage Progress
THR-118
PRO-119
16.6
15.7
-41.5
6.7
33.3
34.7
119.9
PRO-119
ILE-120
19.1
18.3
67.3
-60.5
145.3
152.6
-72.0
ILE-120
ASP-121
16.9
16.4
-0.2
4.5
56.4
64.3
32.2
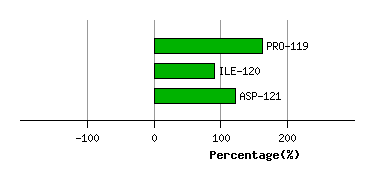
Graph shows rotational transition at bending residues and can be used
to identify hinge bending residues.
Probably only informative for interdomain rotations greater than 20 degrees
Residue
iResidue
i+1Distance of hinge axis to residue i in
(A) Distance of hinge axis to residue i in
(A) Change in
(deg) Change in
(deg) Angle of psi(i) axis to hinge axis
(deg) Angle of psi(i) axis to hinge axis
(deg) Percentage Progress
SER-191
THR-192
2.0
1.9
-1.6
-0.7
62.6
59.9
-12.8
THR-192
SER-193
3.1
2.8
-6.8
-1.9
20.4
17.1
46.8
SER-193
ILE-194
4.2
3.9
-1.8
-0.1
58.0
59.2
31.8
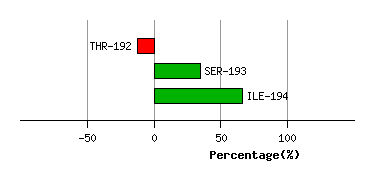
Graph shows rotational transition at bending residues and can be used
to identify hinge bending residues.
Probably only informative for interdomain rotations greater than 20 degrees
Residue
iResidue
i+1Distance of hinge axis to residue i in
(A) Distance of hinge axis to residue i in
(A) Change in
(deg) Change in
(deg) Angle of psi(i) axis to hinge axis
(deg) Angle of psi(i) axis to hinge axis
(deg) Percentage Progress
GLU-195
TYR-196
2.0
1.9
29.9
-16.5
34.1
49.1
50.8
TYR-196
VAL-197
3.8
3.2
-0.6
1.9
148.5
156.4
8.3
VAL-197
THR-198
1.6
1.2
16.0
7.8
69.7
71.1
79.1
THR-198
GLN-199
2.2
2.7
-3.1
-38.4
71.0
61.2
113.2
THR-198
GLN-199
2.2
2.7
-3.1
-38.4
71.0
61.2
113.2
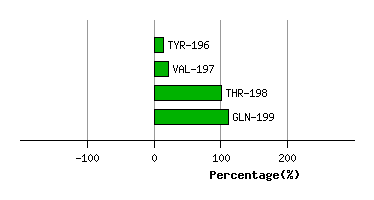
Graph shows rotational transition at bending residues and can be used
to identify hinge bending residues.
Probably only informative for interdomain rotations greater than 20 degrees
Residue
iResidue
i+1Distance of hinge axis to residue i in
(A) Distance of hinge axis to residue i in
(A) Change in
(deg) Change in
(deg) Angle of psi(i) axis to hinge axis
(deg) Angle of psi(i) axis to hinge axis
(deg) Percentage Progress
THR-198
GLN-199
2.2
2.7
-3.1
-38.4
71.0
61.2
113.2
THR-198
GLN-199
2.2
2.7
-3.1
-38.4
71.0
61.2
113.2
GLN-199
ARG-200
4.7
4.7
47.0
-9.0
163.2
138.5
-230.5
ARG-200
ASN-201
3.2
3.2
155.2
61.1
127.2
140.5
672.0
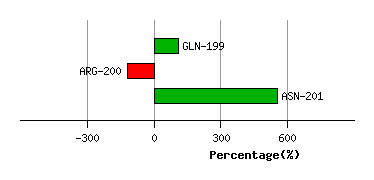
Graph shows rotational transition at bending residues and can be used
to identify hinge bending residues.
Probably only informative for interdomain rotations greater than 20 degrees
Residue
iResidue
i+1Distance of hinge axis to residue i in
(A) Distance of hinge axis to residue i in
(A) Change in
(deg) Change in
(deg) Angle of psi(i) axis to hinge axis
(deg) Angle of psi(i) axis to hinge axis
(deg) Percentage Progress
CYS-202
ASN-203
5.4
4.2
49.1
-20.6
91.1
92.2
-21.5
ASN-203
LEU-204
6.8
6.1
10.9
-2.6
145.6
150.0
-18.4
LEU-204
THR-205
6.1
5.9
0.7
2.8
143.1
133.8
-22.3
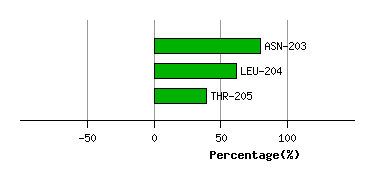
Graph shows rotational transition at bending residues and can be used
to identify hinge bending residues.
Probably only informative for interdomain rotations greater than 20 degrees
Residue
iResidue
i+1Distance of hinge axis to residue i in
(A) Distance of hinge axis to residue i in
(A) Change in
(deg) Change in
(deg) Angle of psi(i) axis to hinge axis
(deg) Angle of psi(i) axis to hinge axis
(deg) Percentage Progress
LEU-210
ILE-211
6.0
6.1
13.2
-9.5
50.2
51.0
13.4
ILE-211
ASP-212
8.6
8.6
9.2
-7.4
29.7
35.8
23.1
ASP-212
SER-213
6.6
6.5
-5.0
11.4
91.0
88.2
-10.9
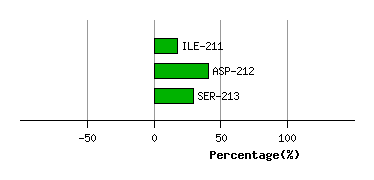
Graph shows rotational transition at bending residues and can be used
to identify hinge bending residues.
Probably only informative for interdomain rotations greater than 20 degrees
Residue
iResidue
i+1Distance of hinge axis to residue i in
(A) Distance of hinge axis to residue i in
(A) Change in
(deg) Change in
(deg) Angle of psi(i) axis to hinge axis
(deg) Angle of psi(i) axis to hinge axis
(deg) Percentage Progress
LYS-249
TRP-250
14.7
14.2
-5.6
6.0
123.6
124.7
-11.0
TRP-250
TRP-251
12.2
11.7
3.8
-11.6
75.4
74.2
13.3
TRP-251
ARG-252
8.9
8.5
-6.0
-51.2
133.7
122.7
-195.0
ARG-252
GLY-253
10.3
10.4
-170.8
35.3
162.8
127.6
-734.9
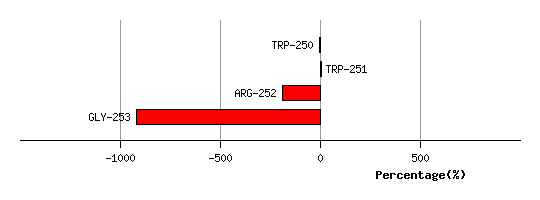
Graph shows rotational transition at bending residues and can be used
to identify hinge bending residues.
Probably only informative for interdomain rotations greater than 20 degrees