Myosin Heavy Chain
(All numbering and residues are taken from first PDB file)
![]()
![]()
Bending Residue Dihedral Analysis
Residue
iResidue
i+1Distance of hinge axis to residue i in
(A) Distance of hinge axis to residue i in
(A) Change in
(deg) Change in
(deg) Angle of psi(i) axis to hinge axis
(deg) Angle of psi(i) axis to hinge axis
(deg) Percentage Progress
HIS-491
MET-492
3.6
3.0
-5.1
-16.6
58.3
51.6
7.5
MET-492
PHE-493
1.4
2.2
5.0
-54.6
157.7
142.2
36.4
PHE-493
ILE-494
1.2
1.6
-14.3
10.4
52.2
62.1
9.4
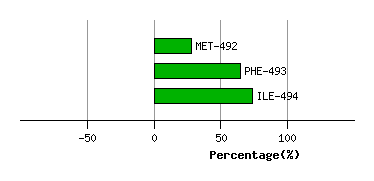
Graph shows rotational transition at bending residues and can be used
to identify hinge bending residues.
Probably only informative for interdomain rotations greater than 20 degrees
Residue
iResidue
i+1Distance of hinge axis to residue i in
(A) Distance of hinge axis to residue i in
(A) Change in
(deg) Change in
(deg) Angle of psi(i) axis to hinge axis
(deg) Angle of psi(i) axis to hinge axis
(deg) Percentage Progress
ALA-506
TRP-507
1.4
1.7
-76.3
10.5
83.6
38.5
9.6
TRP-507
GLU-508
4.6
2.8
-45.3
26.2
80.7
83.0
-0.2
GLU-508
PHE-509
7.5
6.4
-120.2
24.2
26.1
3.1
67.8
PHE-509
ILE-510
10.2
6.7
12.0
-9.9
109.4
120.0
2.0
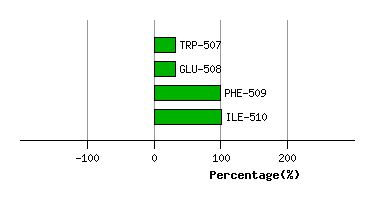
Graph shows rotational transition at bending residues and can be used
to identify hinge bending residues.
Probably only informative for interdomain rotations greater than 20 degrees
Residue
iResidue
i+1Distance of hinge axis to residue i in
(A) Distance of hinge axis to residue i in
(A) Change in
(deg) Change in
(deg) Angle of psi(i) axis to hinge axis
(deg) Angle of psi(i) axis to hinge axis
(deg) Percentage Progress
CYS-693
ASN-694
11.3
10.6
-106.2
12.5
108.4
78.3
2.0
ASN-694
GLY-695
9.0
8.0
88.7
-153.4
136.2
171.1
46.2
ARG-704
LYS-705
8.6
11.6
144.5
-137.2
87.7
150.1
-2.0
LYS-705
GLY-706
10.7
9.5
-105.3
131.6
47.9
65.6
-12.2
GLY-706
PHE-707
10.4
6.8
-120.4
-72.8
37.7
76.9
69.7
PHE-707
PRO-708
7.9
7.9
-47.1
3.9
48.4
132.1
-31.0
PRO-708
SER-709
9.4
9.3
140.3
-2.5
81.0
105.9
52.3
SER-709
ARG-710
12.0
11.7
-16.2
-19.2
48.4
38.5
16.8
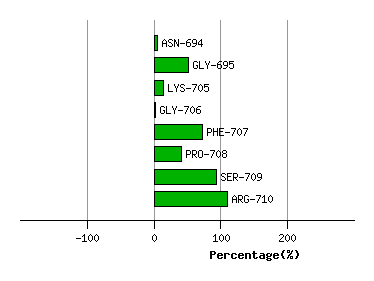
Graph shows rotational transition at bending residues and can be used
to identify hinge bending residues.
Probably only informative for interdomain rotations greater than 20 degrees