Hst2 Protein
(All numbering and residues are taken from first PDB file)
![]()
![]()
Bending Residue Dihedral Analysis
Residue
iResidue
i+1Distance of hinge axis to residue i in
(A) Distance of hinge axis to residue i in
(A) Change in
(deg) Change in
(deg) Angle of psi(i) axis to hinge axis
(deg) Angle of psi(i) axis to hinge axis
(deg) Percentage Progress
THR-37
SER-38
15.8
15.9
-1.4
2.1
146.3
150.0
-1.9
SER-38
CYS-39
17.1
16.8
-42.8
69.3
118.6
112.1
70.2
CYS-39
GLY-40
15.6
14.2
-31.6
33.2
49.5
64.0
-31.6
LEU-55
ALA-56
25.0
20.1
-131.6
-56.9
90.6
34.9
1016.4
ALA-56
ARG-57
23.3
22.9
47.6
70.6
137.7
96.7
-1069.1
ARG-57
LEU-58
22.0
24.0
-161.0
60.8
35.2
67.3
389.9
LEU-58
LYS-59
22.8
20.9
-102.3
10.9
31.7
4.0
754.3
LYS-59
LEU-60
21.7
21.4
-54.3
33.8
78.0
65.3
88.1
LEU-60
PRO-61
18.0
17.6
22.2
-5.9
140.4
141.0
-110.3

Graph shows rotational transition at bending residues and can be used
to identify hinge bending residues.
Probably only informative for interdomain rotations greater than 20 degrees
Residue
iResidue
i+1Distance of hinge axis to residue i in
(A) Distance of hinge axis to residue i in
(A) Change in
(deg) Change in
(deg) Angle of psi(i) axis to hinge axis
(deg) Angle of psi(i) axis to hinge axis
(deg) Percentage Progress
LYS-84
GLU-85
16.2
16.5
-3.3
4.2
53.9
49.8
20.7
GLU-85
LEU-86
15.6
16.3
-19.8
-18.5
83.8
66.6
83.0
LEU-86
TYR-87
11.9
12.7
42.3
-20.1
136.5
115.3
-125.0
TYR-87
PRO-88
10.7
11.8
-9.2
3.6
37.1
17.1
60.9
PRO-88
GLY-89
8.8
9.8
34.3
-132.1
143.5
133.8
653.5
GLY-89
ASN-90
11.0
11.4
122.6
3.4
140.0
131.4
-1021.7
ASN-90
PHE-91
9.7
13.4
-54.9
-22.1
67.1
83.8
92.9
PHE-91
ARG-92
10.5
11.6
-30.4
-20.7
54.6
45.7
283.4
ARG-92
PRO-93
9.8
10.0
20.6
5.4
57.3
74.7
79.1
PRO-93
SER-94
8.6
8.7
2.2
-21.6
107.1
109.5
13.3
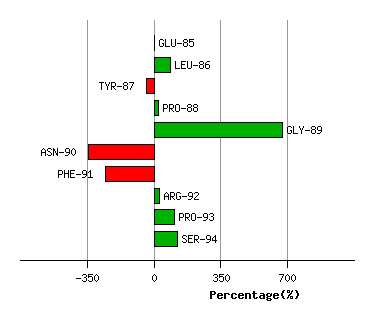
Graph shows rotational transition at bending residues and can be used
to identify hinge bending residues.
Probably only informative for interdomain rotations greater than 20 degrees
Residue
iResidue
i+1Distance of hinge axis to residue i in
(A) Distance of hinge axis to residue i in
(A) Change in
(deg) Change in
(deg) Angle of psi(i) axis to hinge axis
(deg) Angle of psi(i) axis to hinge axis
(deg) Percentage Progress
SER-137
PHE-138
3.4
3.4
8.0
3.3
99.7
99.7
-1.7
PHE-138
ALA-139
7.0
7.1
6.6
-6.3
63.8
61.2
14.1
ALA-139
HIS-140
7.9
7.6
-5.5
5.1
58.5
61.8
9.2
HIS-140
CYS-141
10.2
10.0
-7.0
0.4
26.2
23.7
50.9
CYS-141
HIS-142
11.2
10.9
7.0
-6.2
129.7
130.5
2.1
HIS-142
CYS-143
11.2
11.3
-2.7
8.4
27.6
28.5
-44.7
CYS-143
ILE-144
12.3
12.6
0.9
-0.7
125.9
125.2
6.1
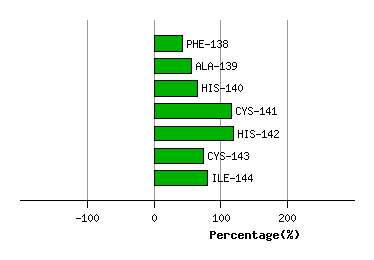
Graph shows rotational transition at bending residues and can be used
to identify hinge bending residues.
Probably only informative for interdomain rotations greater than 20 degrees
Residue
iResidue
i+1Distance of hinge axis to residue i in
(A) Distance of hinge axis to residue i in
(A) Change in
(deg) Change in
(deg) Angle of psi(i) axis to hinge axis
(deg) Angle of psi(i) axis to hinge axis
(deg) Percentage Progress
ILE-181
VAL-182
3.6
3.5
12.6
-16.7
18.3
25.0
-43.4
VAL-182
PHE-183
1.3
0.9
-13.7
8.0
118.9
124.3
-4.8
PHE-183
PHE-184
3.5
3.2
-6.2
8.5
130.1
133.2
16.3

Graph shows rotational transition at bending residues and can be used
to identify hinge bending residues.
Probably only informative for interdomain rotations greater than 20 degrees