Phosphopentomutase
(All numbering and residues are taken from first PDB file)
![]()
![]()
Bending Residue Dihedral Analysis
Residue
iResidue
i+1Distance of hinge axis to residue i in
(A) Distance of hinge axis to residue i in
(A) Change in
(deg) Change in
(deg) Angle of psi(i) axis to hinge axis
(deg) Angle of psi(i) axis to hinge axis
(deg) Percentage Progress
TYR-96
ILE-97
5.2
5.1
0.2
1.8
136.3
133.9
-12.4
ILE-97
ASP-98
2.7
2.5
14.8
-28.4
79.0
75.4
-15.3
ASP-98
THR-99
1.4
1.4
15.5
-9.8
140.7
148.8
46.0
THR-99
PRO-100
2.3
2.1
-8.8
-22.8
59.7
63.1
86.7
PRO-100
PHE-101
3.5
2.7
21.0
-15.2
176.5
166.4
-78.4
PHE-101
GLN-102
3.9
3.9
5.4
19.2
101.7
100.4
55.5
GLN-102
VAL-103
6.8
6.8
-22.3
39.1
45.0
60.4
-41.3
VAL-103
PHE-104
9.7
9.5
167.2
-177.5
113.6
151.9
85.4
PHE-104
PRO-105
11.7
10.9
-9.2
-7.7
62.9
67.2
63.6
PRO-105
GLU-106
15.3
14.0
-2.0
-2.5
46.3
30.6
-8.2
GLU-106
GLY-107
16.3
15.5
-8.7
22.6
50.0
44.9
-27.9
GLY-107
PHE-108
13.0
12.5
9.5
-21.8
61.7
62.8
-38.0
PHE-108
PRO-109
10.8
11.0
-4.2
-1.8
87.6
86.1
-9.3
PRO-109
LYS-110
12.9
13.3
-2.6
1.2
34.3
34.6
-11.5
LYS-110
GLU-111
14.7
14.5
-5.1
1.1
91.4
88.9
15.8
GLU-111
LEU-112
14.1
14.2
6.4
2.0
107.8
94.5
5.2
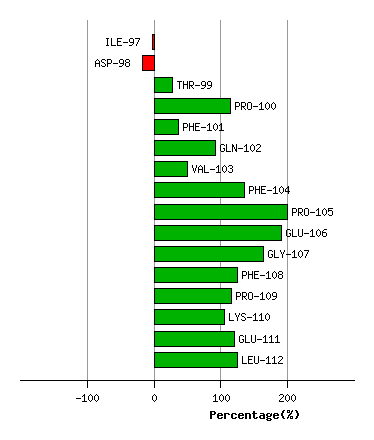
Graph shows rotational transition at bending residues and can be used
to identify hinge bending residues.
Probably only informative for interdomain rotations greater than 20 degrees
Residue
iResidue
i+1Distance of hinge axis to residue i in
(A) Distance of hinge axis to residue i in
(A) Change in
(deg) Change in
(deg) Angle of psi(i) axis to hinge axis
(deg) Angle of psi(i) axis to hinge axis
(deg) Percentage Progress
ASP-214
TYR-215
8.8
8.8
-7.3
9.0
66.4
58.3
-5.4
TYR-215
ALA-216
6.8
6.8
10.5
-20.5
158.3
149.6
41.8
ALA-216
LEU-217
7.0
7.2
-0.6
-12.7
54.5
43.2
19.1
LEU-217
LYS-218
6.6
6.8
-13.9
1.8
54.0
52.8
32.9
LYS-218
PRO-219
9.6
9.8
-4.8
7.0
22.9
23.4
-15.3
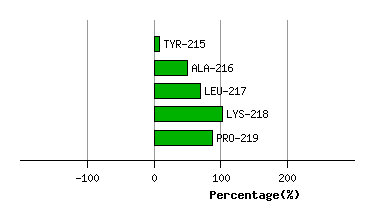
Graph shows rotational transition at bending residues and can be used
to identify hinge bending residues.
Probably only informative for interdomain rotations greater than 20 degrees