Anthranilate Phosphoribosyltransferase
(All numbering and residues are taken from first PDB file)
![]()
![]()
Bending Residue Dihedral Analysis
Residue
iResidue
i+1Distance of hinge axis to residue i in
(A) Distance of hinge axis to residue i in
(A) Change in
(deg) Change in
(deg) Angle of psi(i) axis to hinge axis
(deg) Angle of psi(i) axis to hinge axis
(deg) Percentage Progress
LEU-65
ALA-66
9.4
9.4
7.3
-6.8
108.1
108.6
-7.5
ALA-66
ILE-67
5.6
5.6
-5.9
-0.9
38.1
42.0
75.2
ILE-67
LYS-68
3.5
3.6
2.9
0.4
62.0
61.9
5.3
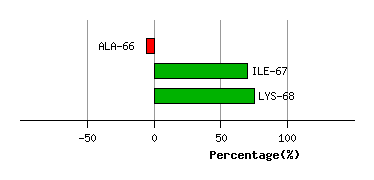
Graph shows rotational transition at bending residues and can be used
to identify hinge bending residues.
Probably only informative for interdomain rotations greater than 20 degrees
Residue
iResidue
i+1Distance of hinge axis to residue i in
(A) Distance of hinge axis to residue i in
(A) Change in
(deg) Change in
(deg) Angle of psi(i) axis to hinge axis
(deg) Angle of psi(i) axis to hinge axis
(deg) Percentage Progress
PHE-147
LEU-148
9.7
9.6
-0.7
-1.7
115.2
114.4
-1.4
LEU-148
PHE-149
6.1
6.0
-10.2
14.4
72.6
77.4
-2.8
PHE-149
ALA-150
7.4
7.5
20.3
-12.6
97.2
100.1
3.8
ALA-150
GLN-151
5.8
6.4
1.4
-18.0
57.8
49.5
-162.8
GLN-151
TYR-152
8.8
8.9
24.2
-5.2
27.7
27.1
255.5
TYR-152
TYR-153
6.8
6.5
-7.1
-2.7
85.4
83.7
-3.9
TYR-153
HIS-154
3.3
3.2
-15.8
13.4
61.1
66.1
-5.4
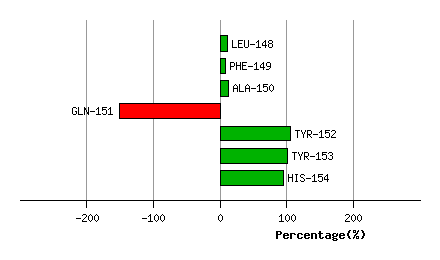
Graph shows rotational transition at bending residues and can be used
to identify hinge bending residues.
Probably only informative for interdomain rotations greater than 20 degrees
Residue
iResidue
i+1Distance of hinge axis to residue i in
(A) Distance of hinge axis to residue i in
(A) Change in
(deg) Change in
(deg) Angle of psi(i) axis to hinge axis
(deg) Angle of psi(i) axis to hinge axis
(deg) Percentage Progress
LEU-179
THR-180
1.7
1.7
-14.2
6.4
26.2
23.0
77.9
THR-180
ASN-181
2.3
2.2
-5.2
4.7
47.2
46.4
13.2
ASN-181
PRO-182
1.9
1.7
3.1
-4.9
147.2
147.3
15.0
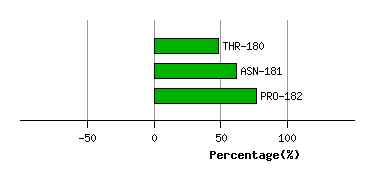
Graph shows rotational transition at bending residues and can be used
to identify hinge bending residues.
Probably only informative for interdomain rotations greater than 20 degrees
Residue
iResidue
i+1Distance of hinge axis to residue i in
(A) Distance of hinge axis to residue i in
(A) Change in
(deg) Change in
(deg) Angle of psi(i) axis to hinge axis
(deg) Angle of psi(i) axis to hinge axis
(deg) Percentage Progress
HIS-197
LEU-198
5.4
5.4
-2.7
-2.4
88.6
93.3
36.2
LEU-198
ASP-199
2.0
2.0
4.0
0.1
99.5
99.7
39.1
ASP-199
LEU-200
2.8
3.0
-3.1
6.9
135.0
138.2
37.6
LEU-200
LEU-201
5.5
5.6
-12.6
4.5
149.0
147.5
-95.1
LEU-201
SER-202
3.3
3.4
11.4
-9.6
94.9
91.5
4.3
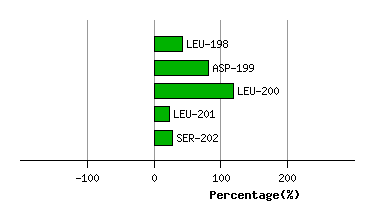
Graph shows rotational transition at bending residues and can be used
to identify hinge bending residues.
Probably only informative for interdomain rotations greater than 20 degrees
Residue
iResidue
i+1Distance of hinge axis to residue i in
(A) Distance of hinge axis to residue i in
(A) Change in
(deg) Change in
(deg) Angle of psi(i) axis to hinge axis
(deg) Angle of psi(i) axis to hinge axis
(deg) Percentage Progress
LYS-203
SER-204
6.9
6.9
-3.5
2.4
155.8
156.9
-18.9
SER-204
ALA-205
7.1
7.1
12.4
-11.1
56.9
51.1
36.9
ALA-205
TYR-206
5.6
5.5
-2.1
-0.2
80.0
84.0
34.4
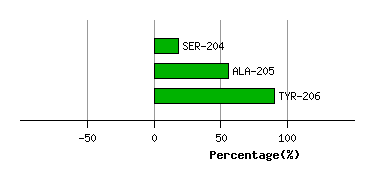
Graph shows rotational transition at bending residues and can be used
to identify hinge bending residues.
Probably only informative for interdomain rotations greater than 20 degrees
Residue
iResidue
i+1Distance of hinge axis to residue i in
(A) Distance of hinge axis to residue i in
(A) Change in
(deg) Change in
(deg) Angle of psi(i) axis to hinge axis
(deg) Angle of psi(i) axis to hinge axis
(deg) Percentage Progress
GLU-207
LEU-208
10.8
10.5
-11.1
4.2
14.3
15.6
74.3
LEU-208
ASP-209
8.9
8.5
0.0
-5.1
120.0
118.5
18.5
ASP-209
PHE-210
11.2
10.6
9.8
-8.0
101.5
103.9
8.5
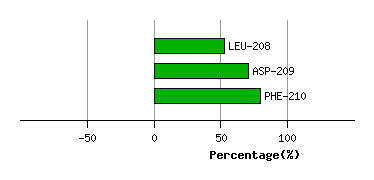
Graph shows rotational transition at bending residues and can be used
to identify hinge bending residues.
Probably only informative for interdomain rotations greater than 20 degrees
Residue
iResidue
i+1Distance of hinge axis to residue i in
(A) Distance of hinge axis to residue i in
(A) Change in
(deg) Change in
(deg) Angle of psi(i) axis to hinge axis
(deg) Angle of psi(i) axis to hinge axis
(deg) Percentage Progress
ILE-235
VAL-236
8.7
8.6
-7.0
6.6
101.9
101.5
18.9
VAL-236
SER-237
8.6
8.4
-4.2
13.5
129.6
132.7
55.9
SER-237
LYS-238
12.0
11.7
3.2
-4.8
97.7
90.5
6.3
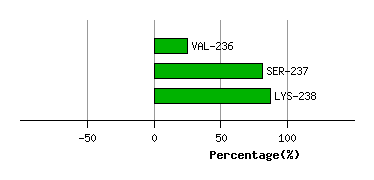
Graph shows rotational transition at bending residues and can be used
to identify hinge bending residues.
Probably only informative for interdomain rotations greater than 20 degrees
Residue
iResidue
i+1Distance of hinge axis to residue i in
(A) Distance of hinge axis to residue i in
(A) Change in
(deg) Change in
(deg) Angle of psi(i) axis to hinge axis
(deg) Angle of psi(i) axis to hinge axis
(deg) Percentage Progress
GLY-240
ILE-241
12.6
12.4
-11.3
-5.1
89.5
85.7
33.8
ILE-241
GLU-242
9.2
9.0
-5.3
3.6
141.9
141.1
-39.7
GLU-242
GLU-243
9.4
9.7
16.6
-16.9
76.0
78.3
70.7
GLU-243
VAL-244
6.8
7.5
6.3
5.0
76.8
78.9
81.0
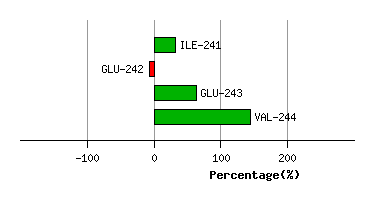
Graph shows rotational transition at bending residues and can be used
to identify hinge bending residues.
Probably only informative for interdomain rotations greater than 20 degrees