Glutamate Transporter Homolog
(All numbering and residues are taken from first PDB file)
![]()
![]()
Bending Residue Dihedral Analysis
Residue
iResidue
i+1Distance of hinge axis to residue i in
(A) Distance of hinge axis to residue i in
(A) Change in
(deg) Change in
(deg) Angle of psi(i) axis to hinge axis
(deg) Angle of psi(i) axis to hinge axis
(deg) Percentage Progress
TYR-10
PRO-11
29.9
30.5
-1.2
3.5
74.2
70.1
7.1
PRO-11
VAL-12
26.1
26.7
-6.3
4.1
12.9
9.3
70.9
VAL-12
LEU-13
24.7
25.7
2.7
0.0
106.7
107.5
-19.5
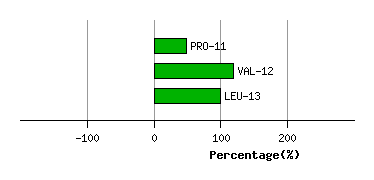
Graph shows rotational transition at bending residues and can be used
to identify hinge bending residues.
Probably only informative for interdomain rotations greater than 20 degrees
Residue
iResidue
i+1Distance of hinge axis to residue i in
(A) Distance of hinge axis to residue i in
(A) Change in
(deg) Change in
(deg) Angle of psi(i) axis to hinge axis
(deg) Angle of psi(i) axis to hinge axis
(deg) Percentage Progress
LEU-17
ILE-18
23.6
23.2
-3.0
-0.4
106.6
105.2
-16.2
ILE-18
GLY-19
27.4
26.9
0.6
2.5
11.2
10.5
49.5
GLY-19
LEU-20
27.3
27.1
0.5
6.9
54.0
56.0
89.5
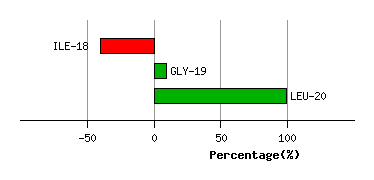
Graph shows rotational transition at bending residues and can be used
to identify hinge bending residues.
Probably only informative for interdomain rotations greater than 20 degrees
Residue
iResidue
i+1Distance of hinge axis to residue i in
(A) Distance of hinge axis to residue i in
(A) Change in
(deg) Change in
(deg) Angle of psi(i) axis to hinge axis
(deg) Angle of psi(i) axis to hinge axis
(deg) Percentage Progress
SER-72
ILE-73
28.3
27.6
11.5
-16.5
78.5
82.6
9.4
ILE-73
SER-74
26.5
26.1
26.5
-7.4
114.8
117.6
-158.2
SER-74
PRO-75
29.5
29.4
-174.4
-9.6
130.8
123.1
-1711.3
PRO-75
ALA-76
31.6
30.8
-142.4
3.7
102.4
123.3
4005.4
ALA-76
ARG-77
31.7
34.0
-2.2
-36.8
165.6
159.3
-732.3
ARG-77
LEU-78
32.8
32.4
-91.1
30.0
120.2
113.6
-581.1
LEU-78
GLY-79
29.5
29.5
159.1
155.4
31.1
46.5
-716.5
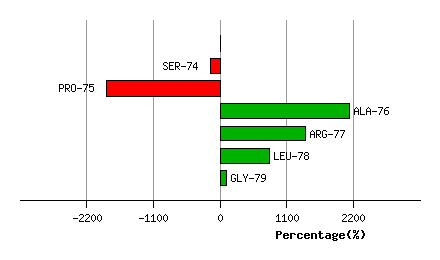
Graph shows rotational transition at bending residues and can be used
to identify hinge bending residues.
Probably only informative for interdomain rotations greater than 20 degrees
Residue
iResidue
i+1Distance of hinge axis to residue i in
(A) Distance of hinge axis to residue i in
(A) Change in
(deg) Change in
(deg) Angle of psi(i) axis to hinge axis
(deg) Angle of psi(i) axis to hinge axis
(deg) Percentage Progress
ILE-102
MET-103
4.9
4.9
1.8
-1.9
94.9
97.7
-29.3
MET-103
ALA-104
3.6
3.6
2.7
0.8
30.9
35.1
52.2
ALA-104
ARG-105
2.5
2.7
0.7
7.8
47.5
48.7
105.9
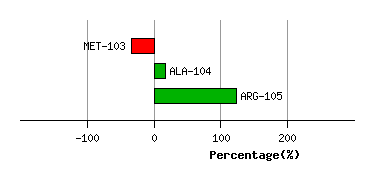
Graph shows rotational transition at bending residues and can be used
to identify hinge bending residues.
Probably only informative for interdomain rotations greater than 20 degrees
Residue
iResidue
i+1Distance of hinge axis to residue i in
(A) Distance of hinge axis to residue i in
(A) Change in
(deg) Change in
(deg) Angle of psi(i) axis to hinge axis
(deg) Angle of psi(i) axis to hinge axis
(deg) Percentage Progress
LEU-106
PHE-107
7.4
7.7
14.1
-21.2
94.8
100.0
2.0
PHE-107
ASN-108
8.0
8.2
2.0
-4.8
156.9
157.1
52.5
ASN-108
PRO-109
6.8
6.8
-2.4
2.0
88.4
89.0
7.6
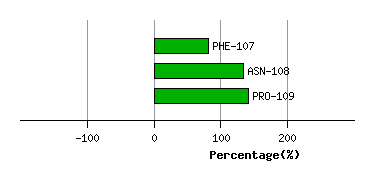
Graph shows rotational transition at bending residues and can be used
to identify hinge bending residues.
Probably only informative for interdomain rotations greater than 20 degrees
Residue
iResidue
i+1Distance of hinge axis to residue i in
(A) Distance of hinge axis to residue i in
(A) Change in
(deg) Change in
(deg) Angle of psi(i) axis to hinge axis
(deg) Angle of psi(i) axis to hinge axis
(deg) Percentage Progress
GLY-110
ALA-111
9.4
9.6
-1.1
20.8
147.5
151.4
299.1
ALA-111
GLY-112
9.5
9.2
-153.7
158.2
103.3
121.3
-69.7
GLY-112
ILE-113
12.7
12.9
-7.9
22.5
115.4
123.5
12.1
ILE-113
HIS-114
13.5
13.5
-4.9
-3.5
131.9
143.0
-243.6
HIS-114
LEU-115
12.7
12.9
18.6
-47.8
83.5
75.3
-53.6
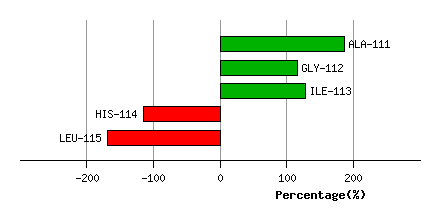
Graph shows rotational transition at bending residues and can be used
to identify hinge bending residues.
Probably only informative for interdomain rotations greater than 20 degrees
Residue
iResidue
i+1Distance of hinge axis to residue i in
(A) Distance of hinge axis to residue i in
(A) Change in
(deg) Change in
(deg) Angle of psi(i) axis to hinge axis
(deg) Angle of psi(i) axis to hinge axis
(deg) Percentage Progress
GLN-120
GLN-121
14.7
13.7
9.7
-3.7
135.7
150.6
-85.1
GLN-121
PHE-122
11.4
11.0
16.5
8.5
97.6
96.3
-29.6
PHE-122
GLN-123
10.0
9.7
18.0
2.1
60.3
55.7
224.1
GLN-123
PRO-124
8.1
8.2
0.6
0.8
106.0
117.0
-5.0
PRO-124
HIS-125
8.2
7.4
-4.5
-8.0
140.8
126.6
-178.5
HIS-125
GLN-126
10.8
10.4
-8.4
-0.8
93.3
95.2
-20.3
GLN-126
ALA-127
11.1
11.2
7.4
-17.5
131.3
135.5
163.5
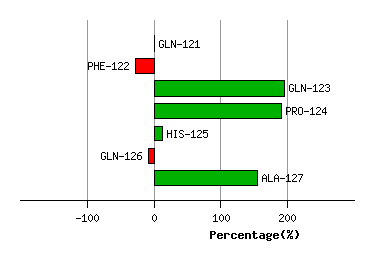
Graph shows rotational transition at bending residues and can be used
to identify hinge bending residues.
Probably only informative for interdomain rotations greater than 20 degrees
Residue
iResidue
i+1Distance of hinge axis to residue i in
(A) Distance of hinge axis to residue i in
(A) Change in
(deg) Change in
(deg) Angle of psi(i) axis to hinge axis
(deg) Angle of psi(i) axis to hinge axis
(deg) Percentage Progress
MET-217
ALA-218
24.6
23.9
3.7
17.7
140.0
135.6
-251.3
ALA-218
HIS-219
27.0
26.7
-34.9
27.6
29.6
33.3
97.9
HIS-219
GLN-220
24.2
24.3
-9.5
31.0
94.1
93.6
26.9
GLN-220
GLY-221
21.1
21.3
-67.1
34.9
131.8
115.7
-369.6
GLY-221
VAL-222
23.3
23.4
-16.9
40.9
165.3
148.7
441.4
VAL-222
HIS-223
22.6
23.0
8.9
1.4
73.9
91.4
131.7
HIS-223
VAL-224
19.3
19.8
-9.6
-4.3
104.7
118.4
-58.3
VAL-224
VAL-225
17.6
18.0
8.8
3.5
5.6
13.0
283.5
VAL-225
GLY-226
18.7
19.0
-7.8
-4.5
114.4
104.4
-77.6
GLY-226
GLU-227
17.2
17.1
-1.0
0.7
89.0
81.5
-55.2
GLU-227
LEU-228
13.7
13.9
-8.9
-4.5
134.8
135.5
-185.4
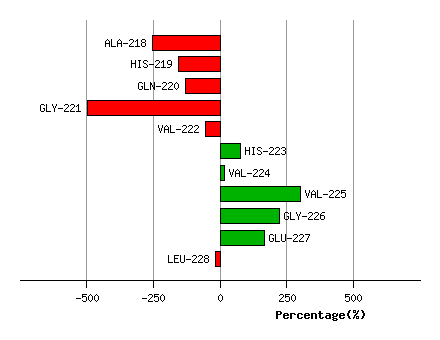
Graph shows rotational transition at bending residues and can be used
to identify hinge bending residues.
Probably only informative for interdomain rotations greater than 20 degrees
Residue
iResidue
i+1Distance of hinge axis to residue i in
(A) Distance of hinge axis to residue i in
(A) Change in
(deg) Change in
(deg) Angle of psi(i) axis to hinge axis
(deg) Angle of psi(i) axis to hinge axis
(deg) Percentage Progress
GLN-318
GLY-319
8.6
8.6
-10.6
5.7
128.4
126.6
-102.8
GLY-319
VAL-320
5.6
5.6
-1.0
0.3
107.8
110.2
7.1
VAL-320
ALA-321
4.0
3.9
1.2
0.6
52.7
51.3
17.8
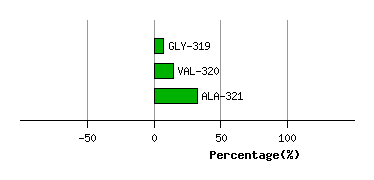
Graph shows rotational transition at bending residues and can be used
to identify hinge bending residues.
Probably only informative for interdomain rotations greater than 20 degrees
Residue
iResidue
i+1Distance of hinge axis to residue i in
(A) Distance of hinge axis to residue i in
(A) Change in
(deg) Change in
(deg) Angle of psi(i) axis to hinge axis
(deg) Angle of psi(i) axis to hinge axis
(deg) Percentage Progress
GLY-330
SER-331
6.2
6.3
-17.0
8.1
77.5
80.1
44.6
SER-331
HIS-332
3.3
3.4
-6.5
-0.1
122.8
132.7
-81.7
HIS-332
LEU-333
0.7
0.5
-9.9
20.0
111.8
103.9
55.2
LEU-333
THR-334
3.6
3.6
10.2
-5.5
98.4
99.6
1.0
THR-334
VAL-335
6.9
6.6
4.5
0.0
33.1
36.2
70.1
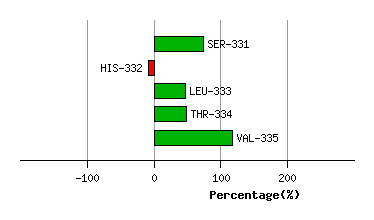
Graph shows rotational transition at bending residues and can be used
to identify hinge bending residues.
Probably only informative for interdomain rotations greater than 20 degrees
Residue
iResidue
i+1Distance of hinge axis to residue i in
(A) Distance of hinge axis to residue i in
(A) Change in
(deg) Change in
(deg) Angle of psi(i) axis to hinge axis
(deg) Angle of psi(i) axis to hinge axis
(deg) Percentage Progress
VAL-355
PRO-356
21.3
20.8
16.1
-1.5
66.8
63.8
118.6
PRO-356
GLY-357
19.5
19.3
-0.2
-0.3
164.3
167.5
2.6
GLY-357
ALA-358
19.0
18.8
0.3
14.8
54.0
59.6
142.5
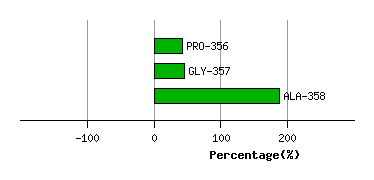
Graph shows rotational transition at bending residues and can be used
to identify hinge bending residues.
Probably only informative for interdomain rotations greater than 20 degrees
Residue
iResidue
i+1Distance of hinge axis to residue i in
(A) Distance of hinge axis to residue i in
(A) Change in
(deg) Change in
(deg) Angle of psi(i) axis to hinge axis
(deg) Angle of psi(i) axis to hinge axis
(deg) Percentage Progress
MET-362
LEU-363
17.2
17.2
-2.8
-4.8
56.7
55.1
101.6
LEU-363
ALA-364
14.1
14.3
0.5
1.2
161.7
159.8
-39.7
ALA-364
MET-365
16.2
16.4
-0.4
0.9
79.5
78.9
4.1
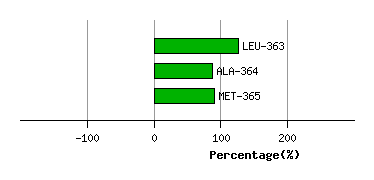
Graph shows rotational transition at bending residues and can be used
to identify hinge bending residues.
Probably only informative for interdomain rotations greater than 20 degrees