Endo-1,4-Beta-Xylanase A
(All numbering and residues are taken from first PDB file)
![]()
![]()
Bending Residue Dihedral Analysis
Residue
iResidue
i+1Distance of hinge axis to residue i in
(A) Distance of hinge axis to residue i in
(A) Change in
(deg) Change in
(deg) Angle of psi(i) axis to hinge axis
(deg) Angle of psi(i) axis to hinge axis
(deg) Percentage Progress
ASP-4
TYR-5
10.7
11.0
-2.9
-5.3
42.4
38.2
183.1
TYR-5
TRP-6
8.1
8.3
2.5
-0.5
84.1
83.5
-34.3
TRP-6
GLN-7
4.5
4.6
0.9
-8.0
125.3
128.8
81.6
GLN-7
ASN-8
4.3
4.4
-1.9
7.9
78.2
80.8
-19.4
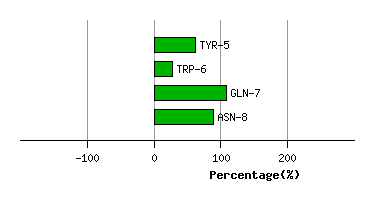
Graph shows rotational transition at bending residues and can be used
to identify hinge bending residues.
Probably only informative for interdomain rotations greater than 20 degrees
Residue
iResidue
i+1Distance of hinge axis to residue i in
(A) Distance of hinge axis to residue i in
(A) Change in
(deg) Change in
(deg) Angle of psi(i) axis to hinge axis
(deg) Angle of psi(i) axis to hinge axis
(deg) Percentage Progress
ASN-20
GLY-21
5.0
4.8
-2.6
4.2
59.8
56.5
7.7
GLY-21
SER-22
7.5
7.1
-4.9
3.1
74.4
77.7
35.8
SER-22
GLY-23
9.8
9.3
-2.0
-7.1
55.6
60.1
77.6
GLY-23
GLY-24
9.3
9.0
4.6
-1.6
80.5
84.8
-19.4
GLY-24
ASN-25
6.0
5.7
2.2
3.2
83.2
89.0
9.3
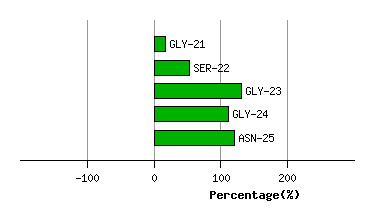
Graph shows rotational transition at bending residues and can be used
to identify hinge bending residues.
Probably only informative for interdomain rotations greater than 20 degrees
Residue
iResidue
i+1Distance of hinge axis to residue i in
(A) Distance of hinge axis to residue i in
(A) Change in
(deg) Change in
(deg) Angle of psi(i) axis to hinge axis
(deg) Angle of psi(i) axis to hinge axis
(deg) Percentage Progress
ASN-29
TRP-30
11.3
11.3
-6.8
5.9
34.8
37.3
42.1
TRP-30
SER-31
12.7
12.7
0.4
9.2
93.2
91.5
-128.2
SER-31
ASN-32
16.1
16.1
-15.7
-8.3
39.4
49.8
365.8
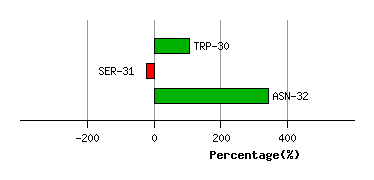
Graph shows rotational transition at bending residues and can be used
to identify hinge bending residues.
Probably only informative for interdomain rotations greater than 20 degrees
Residue
iResidue
i+1Distance of hinge axis to residue i in
(A) Distance of hinge axis to residue i in
(A) Change in
(deg) Change in
(deg) Angle of psi(i) axis to hinge axis
(deg) Angle of psi(i) axis to hinge axis
(deg) Percentage Progress
PHE-36
VAL-37
10.5
10.5
-0.2
-4.6
36.6
37.1
33.3
VAL-37
VAL-38
8.4
8.4
-3.5
-2.9
91.7
91.9
24.9
VAL-38
GLY-39
4.8
4.8
-11.6
6.6
33.2
29.0
52.1
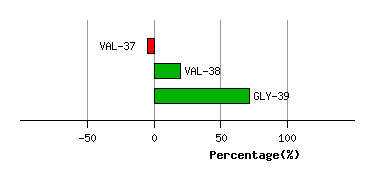
Graph shows rotational transition at bending residues and can be used
to identify hinge bending residues.
Probably only informative for interdomain rotations greater than 20 degrees
Residue
iResidue
i+1Distance of hinge axis to residue i in
(A) Distance of hinge axis to residue i in
(A) Change in
(deg) Change in
(deg) Angle of psi(i) axis to hinge axis
(deg) Angle of psi(i) axis to hinge axis
(deg) Percentage Progress
GLY-56
VAL-57
6.4
6.5
-3.6
4.2
74.8
74.0
28.4
VAL-57
TRP-58
9.1
9.1
-7.8
4.6
65.8
72.0
15.3
TRP-58
ALA-59
10.1
10.2
16.1
-13.2
94.8
92.9
87.6
ALA-59
PRO-60
13.6
13.6
-0.5
-4.8
30.7
33.8
104.9
PRO-60
ASN-61
14.8
14.8
15.0
-4.3
84.8
87.2
751.3
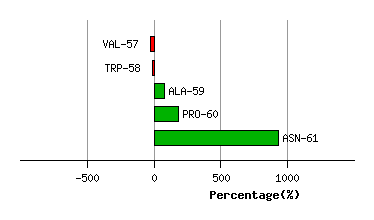
Graph shows rotational transition at bending residues and can be used
to identify hinge bending residues.
Probably only informative for interdomain rotations greater than 20 degrees
Residue
iResidue
i+1Distance of hinge axis to residue i in
(A) Distance of hinge axis to residue i in
(A) Change in
(deg) Change in
(deg) Angle of psi(i) axis to hinge axis
(deg) Angle of psi(i) axis to hinge axis
(deg) Percentage Progress
GLY-62
ASN-63
19.7
19.9
4.5
-8.2
95.2
106.4
-261.9
ASN-63
GLY-64
18.2
18.2
-12.8
8.2
99.9
94.5
-183.9
GLY-64
TYR-65
14.4
14.6
-27.1
-4.2
45.8
37.2
560.0
TYR-65
LEU-66
12.9
12.9
-2.2
10.4
77.9
79.1
-117.2
LEU-66
THR-67
9.7
9.8
-1.3
1.6
77.7
78.0
-10.8
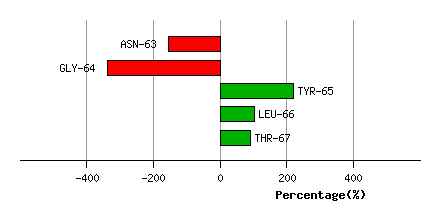
Graph shows rotational transition at bending residues and can be used
to identify hinge bending residues.
Probably only informative for interdomain rotations greater than 20 degrees
Residue
iResidue
i+1Distance of hinge axis to residue i in
(A) Distance of hinge axis to residue i in
(A) Change in
(deg) Change in
(deg) Angle of psi(i) axis to hinge axis
(deg) Angle of psi(i) axis to hinge axis
(deg) Percentage Progress
MET-169
ALA-170
6.3
6.5
-0.8
0.3
58.2
58.5
37.8
ALA-170
THR-171
6.5
6.6
2.1
4.0
72.4
73.8
120.5
THR-171
GLU-172
7.7
7.9
0.6
-14.2
146.3
146.1
221.9
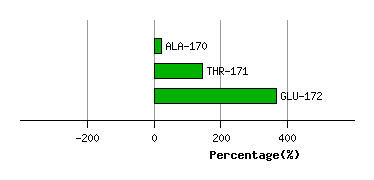
Graph shows rotational transition at bending residues and can be used
to identify hinge bending residues.
Probably only informative for interdomain rotations greater than 20 degrees
Residue
iResidue
i+1Distance of hinge axis to residue i in
(A) Distance of hinge axis to residue i in
(A) Change in
(deg) Change in
(deg) Angle of psi(i) axis to hinge axis
(deg) Angle of psi(i) axis to hinge axis
(deg) Percentage Progress
GLY-178
SER-179
14.6
14.6
4.3
8.5
89.9
87.3
-91.4
SER-179
SER-180
11.8
11.8
-8.2
4.3
49.2
52.9
96.7
SER-180
ASN-181
8.4
8.4
1.9
-1.8
89.2
88.2
58.2
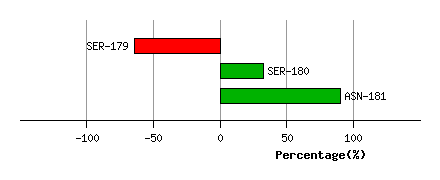
Graph shows rotational transition at bending residues and can be used
to identify hinge bending residues.
Probably only informative for interdomain rotations greater than 20 degrees