Phosphoenolpyruvate-Protein Kinase (Pts System Ei Component In Bacteria)
(All numbering and residues are taken from first PDB file)
![]()
![]()
Bending Residue Dihedral Analysis
Residue
iResidue
i+1Distance of hinge axis to residue i in
(A) Distance of hinge axis to residue i in
(A) Change in
(deg) Change in
(deg) Angle of psi(i) axis to hinge axis
(deg) Angle of psi(i) axis to hinge axis
(deg) Percentage Progress
PHE-295
ARG-296
14.2
14.2
-2.8
2.7
63.3
61.3
10.7
ARG-296
THR-297
11.9
11.9
-29.0
33.6
137.6
133.3
19.7
THR-297
GLU-298
8.8
8.9
-25.6
11.2
82.5
79.7
55.1
GLU-298
PHE-299
8.2
8.1
-18.9
-6.8
134.7
124.5
-40.0
PHE-299
LEU-300
10.4
11.4
-7.2
11.6
130.9
162.0
-3.2
LEU-300
TYR-301
7.3
9.8
-18.3
34.5
70.0
88.5
-3.2
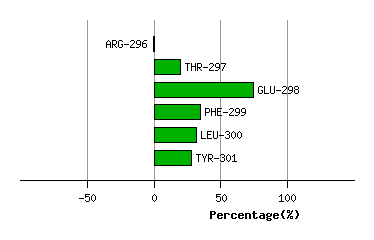
Graph shows rotational transition at bending residues and can be used
to identify hinge bending residues.
Probably only informative for interdomain rotations greater than 20 degrees
Residue
iResidue
i+1Distance of hinge axis to residue i in
(A) Distance of hinge axis to residue i in
(A) Change in
(deg) Change in
(deg) Angle of psi(i) axis to hinge axis
(deg) Angle of psi(i) axis to hinge axis
(deg) Percentage Progress
PRO-308
SER-309
3.4
3.4
-2.7
-2.9
65.6
85.3
-22.6
SER-309
GLU-310
1.6
1.4
14.7
6.8
88.6
93.9
10.9
GLU-310
GLU-311
2.5
3.0
-10.8
1.6
46.2
42.1
18.4
GLU-311
GLU-312
2.3
2.3
6.4
-8.3
75.3
82.5
-12.8
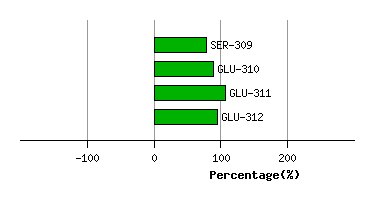
Graph shows rotational transition at bending residues and can be used
to identify hinge bending residues.
Probably only informative for interdomain rotations greater than 20 degrees
Residue
iResidue
i+1Distance of hinge axis to residue i in
(A) Distance of hinge axis to residue i in
(A) Change in
(deg) Change in
(deg) Angle of psi(i) axis to hinge axis
(deg) Angle of psi(i) axis to hinge axis
(deg) Percentage Progress
ARG-332
THR-333
10.8
11.2
7.4
2.6
75.7
74.5
24.4
ASP-335
ILE-336
5.5
5.9
0.5
45.8
99.8
94.9
-41.1
ILE-336
GLY-337
5.0
5.4
-9.3
-102.0
50.2
19.8
392.9
GLY-337
GLY-338
5.1
5.9
-179.5
-35.7
94.8
28.5
-405.0
GLY-338
ASP-339
8.0
8.2
-101.1
-4.7
83.0
104.5
-42.0
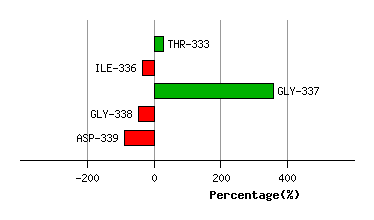
Graph shows rotational transition at bending residues and can be used
to identify hinge bending residues.
Probably only informative for interdomain rotations greater than 20 degrees
Residue
iResidue
i+1Distance of hinge axis to residue i in
(A) Distance of hinge axis to residue i in
(A) Change in
(deg) Change in
(deg) Angle of psi(i) axis to hinge axis
(deg) Angle of psi(i) axis to hinge axis
(deg) Percentage Progress
MET-347
PRO-348
9.3
10.1
7.7
-7.9
32.3
40.4
-10.3
PRO-348
LYS-349
10.4
11.9
13.4
3.3
63.8
52.8
74.1
LYS-349
GLU-350
11.8
12.0
20.5
4.7
36.9
43.2
94.8
GLU-350
MET-351
9.3
9.5
4.6
3.6
49.4
42.7
33.7
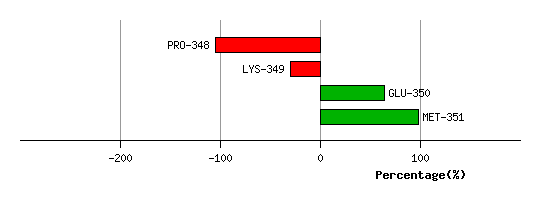
Graph shows rotational transition at bending residues and can be used
to identify hinge bending residues.
Probably only informative for interdomain rotations greater than 20 degrees