Epidermal Growth Factor Receptor
(All numbering and residues are taken from first PDB file)
![]()
![]()
Bending Residue Dihedral Analysis
Residue
iResidue
i+1Distance of hinge axis to residue i in
(A) Distance of hinge axis to residue i in
(A) Change in
(deg) Change in
(deg) Angle of psi(i) axis to hinge axis
(deg) Angle of psi(i) axis to hinge axis
(deg) Percentage Progress
LEU-243
MET-244
7.9
5.9
9.6
-26.4
144.2
149.6
117.7
MET-244
LEU-245
5.7
4.9
10.4
-2.3
136.5
135.5
-66.9
LEU-245
TYR-246
7.3
6.6
-30.3
26.3
35.1
29.5
24.6
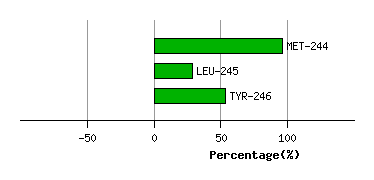
Graph shows rotational transition at bending residues and can be used
to identify hinge bending residues.
Probably only informative for interdomain rotations greater than 20 degrees
Residue
iResidue
i+1Distance of hinge axis to residue i in
(A) Distance of hinge axis to residue i in
(A) Change in
(deg) Change in
(deg) Angle of psi(i) axis to hinge axis
(deg) Angle of psi(i) axis to hinge axis
(deg) Percentage Progress
TYR-251
GLN-252
2.0
2.0
-3.3
1.4
27.5
37.3
22.9
GLN-252
MET-253
1.7
1.5
14.3
-14.9
126.8
132.4
35.9
MET-253
ASP-254
3.0
2.4
36.8
-40.1
108.7
111.4
16.0
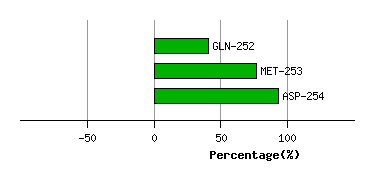
Graph shows rotational transition at bending residues and can be used
to identify hinge bending residues.
Probably only informative for interdomain rotations greater than 20 degrees
Residue
iResidue
i+1Distance of hinge axis to residue i in
(A) Distance of hinge axis to residue i in
(A) Change in
(deg) Change in
(deg) Angle of psi(i) axis to hinge axis
(deg) Angle of psi(i) axis to hinge axis
(deg) Percentage Progress
CYS-305
GLU-306
11.6
11.5
-158.4
-157.4
61.6
60.6
-110.6
GLU-306
GLY-307
14.2
13.7
-92.6
29.0
118.7
136.4
-76.7
GLY-307
PRO-308
16.6
16.5
120.5
-73.0
47.6
26.5
138.7
PRO-308
CYS-309
15.3
15.1
26.9
-47.5
54.7
87.3
-18.3
CYS-309
ARG-310
13.0
12.6
10.1
-5.8
41.2
43.9
12.8
ARG-310
LYS-311
15.2
14.6
19.6
-18.4
17.2
21.0
-12.0
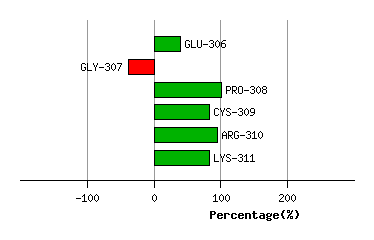
Graph shows rotational transition at bending residues and can be used
to identify hinge bending residues.
Probably only informative for interdomain rotations greater than 20 degrees