Pneumolysin
(All numbering and residues are taken from first PDB file)
![]()
![]()
Bending Residue Dihedral Analysis
Residue
iResidue
i+1Distance of hinge axis to residue i in
(A) Distance of hinge axis to residue i in
(A) Change in
(deg) Change in
(deg) Angle of psi(i) axis to hinge axis
(deg) Angle of psi(i) axis to hinge axis
(deg) Percentage Progress
ARG-51
SER-52
12.6
11.7
2.4
-41.8
118.4
104.7
16.5
SER-52
LEU-53
9.4
11.2
148.2
-13.0
151.7
116.4
-112.4
ARG-51
SER-52
20.8
27.2
2.4
-41.8
119.9
111.8
20.6
ARG-51
SER-52
12.6
11.7
2.4
-41.8
118.4
104.7
16.5
SER-52
LEU-53
9.4
11.2
148.2
-13.0
151.7
116.4
-112.4
GLY-36
ASN-37
4.1
8.0
43.5
-16.4
78.5
54.5
36.8
ASN-37
GLN-38
0.6
6.6
-67.9
-76.2
70.4
90.1
-44.7
GLN-38
LEU-39
4.1
8.4
-120.9
-10.6
55.8
35.9
137.0
LEU-39
PRO-40
5.4
7.3
115.2
-88.7
88.6
86.0
12.4
PRO-40
ASP-41
9.2
4.0
-144.8
-41.7
61.6
99.9
-180.6
ASP-41
GLU-42
9.7
0.4
132.2
5.9
90.8
120.8
60.8
GLU-42
PHE-43
7.2
2.8
19.8
-49.5
38.4
94.7
-10.4
PHE-43
VAL-44
5.8
6.2
26.3
-17.5
123.2
146.8
-4.4
VAL-44
VAL-45
3.6
8.3
61.0
-49.9
59.7
84.9
8.5
VAL-45
ILE-46
6.0
12.0
52.6
-38.7
127.9
156.6
-16.4
ILE-46
GLU-47
7.0
14.4
-0.7
5.1
112.4
89.1
7.1
GLU-47
ARG-48
10.8
17.7
40.8
-16.9
122.0
150.2
-25.3
ARG-48
LYS-49
13.2
20.2
13.0
8.4
80.2
106.1
0.3
LYS-49
LYS-50
16.8
22.6
24.8
-70.1
123.6
128.9
32.6
LYS-50
ARG-51
19.9
25.6
25.1
-6.0
137.0
129.7
-19.6
ARG-51
SER-52
20.8
27.2
2.4
-41.8
119.9
111.8
20.6
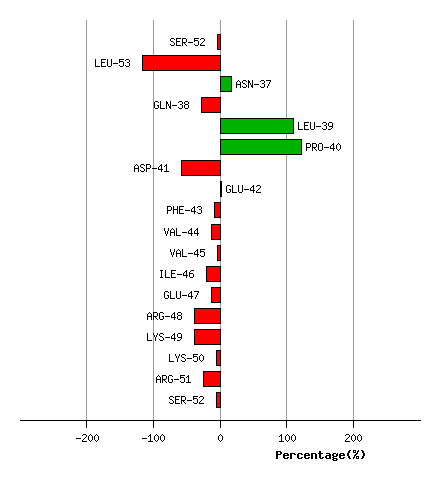
Graph shows rotational transition at bending residues and can be used
to identify hinge bending residues.
Probably only informative for interdomain rotations greater than 20 degrees
Residue
iResidue
i+1Distance of hinge axis to residue i in
(A) Distance of hinge axis to residue i in
(A) Change in
(deg) Change in
(deg) Angle of psi(i) axis to hinge axis
(deg) Angle of psi(i) axis to hinge axis
(deg) Percentage Progress
TYR-358
ARG-359
9.5
7.7
-175.6
-71.4
91.4
152.4
143.1
ARG-359
ASN-360
10.9
10.4
-109.0
-38.7
144.7
79.8
116.8
ASN-360
GLY-361
12.4
13.3
9.0
-103.1
104.9
73.3
30.5
GLY-361
ASP-362
16.1
15.5
-80.6
10.4
131.3
151.4
-69.0
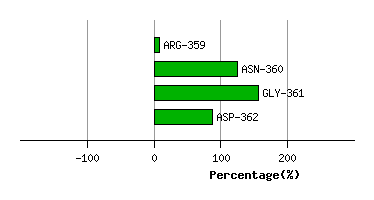
Graph shows rotational transition at bending residues and can be used
to identify hinge bending residues.
Probably only informative for interdomain rotations greater than 20 degrees