D-Mandelate Dehydrogenase
(All numbering and residues are taken from first PDB file)
![]()
![]()
Bending Residue Dihedral Analysis
Residue
iResidue
i+1Distance of hinge axis to residue i in
(A) Distance of hinge axis to residue i in
(A) Change in
(deg) Change in
(deg) Angle of psi(i) axis to hinge axis
(deg) Angle of psi(i) axis to hinge axis
(deg) Percentage Progress
ALA-107
ASN-108
3.9
3.9
12.0
-7.3
126.7
125.5
-32.5
ASN-108
SER-109
1.3
1.3
-6.2
-1.6
37.7
32.7
63.0
SER-109
ARG-110
0.6
0.5
6.2
-0.5
91.8
90.3
-2.3
ARG-110
GLY-111
4.2
4.1
-2.1
7.8
45.0
44.7
-44.8
GLY-111
ALA-112
6.7
6.6
4.4
-25.2
158.6
158.0
127.8
ALA-112
GLY-113
4.3
4.3
21.7
-10.2
124.3
119.1
-19.3
GLY-113
ASP-114
7.1
7.1
-31.2
8.4
102.3
91.6
-15.9
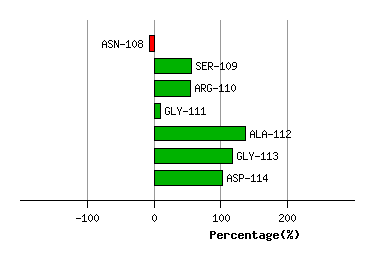
Graph shows rotational transition at bending residues and can be used
to identify hinge bending residues.
Probably only informative for interdomain rotations greater than 20 degrees
Residue
iResidue
i+1Distance of hinge axis to residue i in
(A) Distance of hinge axis to residue i in
(A) Change in
(deg) Change in
(deg) Angle of psi(i) axis to hinge axis
(deg) Angle of psi(i) axis to hinge axis
(deg) Percentage Progress
THR-312
PHE-313
3.9
3.8
-0.6
9.6
81.2
80.1
6.6
PHE-313
HIS-314
2.8
3.1
-11.8
5.8
105.9
98.4
-17.6
HIS-314
GLU-315
1.1
1.4
-6.7
3.3
32.9
31.6
18.5
GLU-315
PHE-316
2.1
1.9
-0.5
-8.6
37.3
38.8
51.9
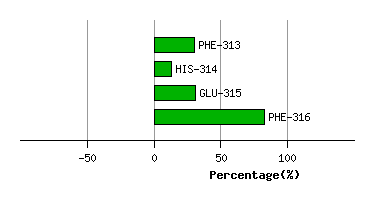
Graph shows rotational transition at bending residues and can be used
to identify hinge bending residues.
Probably only informative for interdomain rotations greater than 20 degrees