Sucrose Isomerase
(All numbering and residues are taken from first PDB file)
![]()
![]()
Bending Residue Dihedral Analysis
Residue
iResidue
i+1Distance of hinge axis to residue i in
(A) Distance of hinge axis to residue i in
(A) Change in
(deg) Change in
(deg) Angle of psi(i) axis to hinge axis
(deg) Angle of psi(i) axis to hinge axis
(deg) Percentage Progress
HIS-54
TYR-55
1.9
2.5
1.1
5.8
51.3
48.5
23.7
TYR-55
ALA-56
3.7
3.7
3.8
0.3
38.4
38.1
49.6
ALA-56
SER-57
5.6
5.6
0.9
3.1
108.4
109.2
-23.1
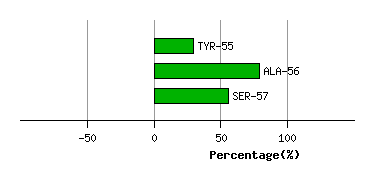
Graph shows rotational transition at bending residues and can be used
to identify hinge bending residues.
Probably only informative for interdomain rotations greater than 20 degrees
Residue
iResidue
i+1Distance of hinge axis to residue i in
(A) Distance of hinge axis to residue i in
(A) Change in
(deg) Change in
(deg) Angle of psi(i) axis to hinge axis
(deg) Angle of psi(i) axis to hinge axis
(deg) Percentage Progress
ARG-70
GLU-71
8.6
8.2
0.7
3.1
140.4
139.1
-46.2
GLU-71
VAL-72
5.8
5.4
-2.7
11.4
112.0
112.0
26.8
VAL-72
MET-73
2.1
1.6
-5.4
-1.4
63.5
59.6
95.7
MET-73
LYS-74
2.8
3.1
18.3
-8.1
145.1
144.8
-80.7
LYS-74
GLU-75
2.7
3.2
-2.5
7.0
89.6
92.7
-36.1
GLU-75
TYR-76
6.0
6.4
-8.0
7.6
118.0
119.8
63.9
TYR-76
GLY-77
5.3
5.5
-10.3
2.6
63.4
64.1
5.6
GLY-77
THR-78
4.5
4.7
4.7
-4.7
96.2
92.1
-18.5
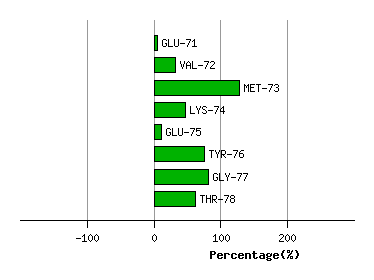
Graph shows rotational transition at bending residues and can be used
to identify hinge bending residues.
Probably only informative for interdomain rotations greater than 20 degrees
Residue
iResidue
i+1Distance of hinge axis to residue i in
(A) Distance of hinge axis to residue i in
(A) Change in
(deg) Change in
(deg) Angle of psi(i) axis to hinge axis
(deg) Angle of psi(i) axis to hinge axis
(deg) Percentage Progress
LEU-96
MET-97
7.3
7.2
-4.0
5.7
62.2
59.8
12.7
MET-97
VAL-98
3.8
3.6
-14.0
21.9
135.9
138.6
46.9
VAL-98
ASP-99
0.9
0.9
3.1
-14.4
116.7
114.9
93.6
ASP-99
VAL-100
2.9
2.9
-10.6
4.0
107.5
109.4
-84.2
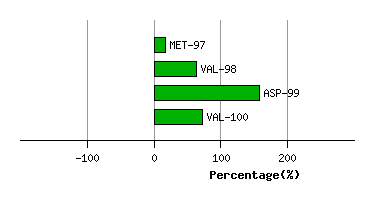
Graph shows rotational transition at bending residues and can be used
to identify hinge bending residues.
Probably only informative for interdomain rotations greater than 20 degrees
Residue
iResidue
i+1Distance of hinge axis to residue i in
(A) Distance of hinge axis to residue i in
(A) Change in
(deg) Change in
(deg) Angle of psi(i) axis to hinge axis
(deg) Angle of psi(i) axis to hinge axis
(deg) Percentage Progress
LEU-190
ASP-191
10.6
10.4
6.2
3.4
112.9
109.9
-50.2
ASP-191
LYS-192
13.7
13.6
-3.7
-2.8
50.9
60.1
60.9
LYS-192
GLY-193
11.8
11.7
4.0
-18.0
53.8
47.8
-116.1
GLY-193
VAL-194
11.8
11.8
16.6
-0.6
59.8
68.4
-5.0
VAL-194
SER-195
8.2
8.1
1.8
40.8
15.7
3.9
500.4
SER-195
GLY-196
8.4
8.1
-33.6
-10.4
127.8
126.2
-335.9
GLY-196
MET-197
4.8
4.6
13.3
2.3
118.8
121.8
-71.3
MET-197
ARG-198
3.3
2.9
-0.5
2.4
126.7
124.3
13.2
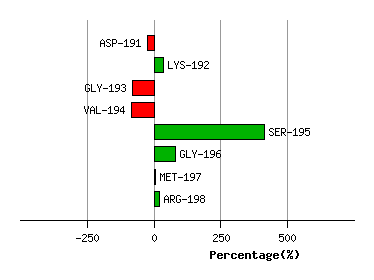
Graph shows rotational transition at bending residues and can be used
to identify hinge bending residues.
Probably only informative for interdomain rotations greater than 20 degrees
Residue
iResidue
i+1Distance of hinge axis to residue i in
(A) Distance of hinge axis to residue i in
(A) Change in
(deg) Change in
(deg) Angle of psi(i) axis to hinge axis
(deg) Angle of psi(i) axis to hinge axis
(deg) Percentage Progress
ASP-275
MET-276
4.3
4.1
-4.3
12.8
108.7
107.8
23.2
MET-276
ALA-277
1.1
1.3
-14.6
2.4
68.4
73.2
-12.1
ALA-277
PHE-278
4.2
4.8
-11.5
17.7
62.3
68.8
27.7
PHE-278
THR-279
6.6
7.2
-4.8
16.2
108.1
113.4
35.8
THR-279
PHE-280
10.0
10.4
1.6
-7.2
106.2
109.7
20.4
PHE-280
ASP-281
13.4
13.9
-13.8
12.3
131.2
129.9
-70.0
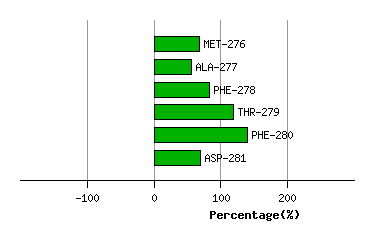
Graph shows rotational transition at bending residues and can be used
to identify hinge bending residues.
Probably only informative for interdomain rotations greater than 20 degrees
Residue
iResidue
i+1Distance of hinge axis to residue i in
(A) Distance of hinge axis to residue i in
(A) Change in
(deg) Change in
(deg) Angle of psi(i) axis to hinge axis
(deg) Angle of psi(i) axis to hinge axis
(deg) Percentage Progress
LYS-308
VAL-309
11.8
12.2
-15.7
10.2
129.3
130.2
-5.7
VAL-309
ASP-310
9.6
10.2
-4.2
8.6
72.3
72.3
-32.9
ASP-310
ALA-311
7.4
7.9
-12.6
20.6
42.8
49.2
17.8
ALA-311
ILE-312
7.0
7.4
-8.6
2.3
107.2
114.4
-82.9
ILE-312
ALA-313
7.2
7.2
5.5
7.5
66.7
66.6
131.8
ALA-313
GLY-314
3.8
3.7
4.0
1.6
139.6
138.2
-70.1
GLY-314
GLU-315
2.3
2.6
-2.8
-8.4
91.2
90.8
15.1
GLU-315
TYR-316
1.6
2.1
2.6
2.8
38.3
31.5
45.2
TYR-316
GLY-317
4.0
4.3
-1.4
-1.1
158.5
155.2
-8.2
GLY-317
TRP-318
2.3
2.6
-6.9
1.5
108.8
103.9
-7.3
TRP-318
ASN-319
0.8
0.6
-2.3
6.0
129.3
127.8
28.2
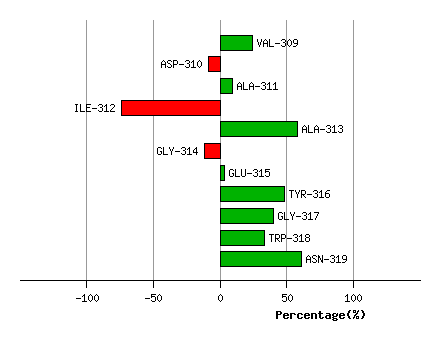
Graph shows rotational transition at bending residues and can be used
to identify hinge bending residues.
Probably only informative for interdomain rotations greater than 20 degrees