Ribokinase
(All numbering and residues are taken from first PDB file)
![]()
![]()
Bending Residue Dihedral Analysis
Residue
iResidue
i+1Distance of hinge axis to residue i in
(A) Distance of hinge axis to residue i in
(A) Change in
(deg) Change in
(deg) Angle of psi(i) axis to hinge axis
(deg) Angle of psi(i) axis to hinge axis
(deg) Percentage Progress
MET-25
THR-26
3.9
3.6
4.6
-13.0
169.8
170.9
107.4
THR-26
ASP-27
3.2
3.0
9.0
-3.1
103.0
101.0
-28.8
ASP-27
LEU-28
5.8
5.6
-3.4
-0.5
28.4
29.3
60.4
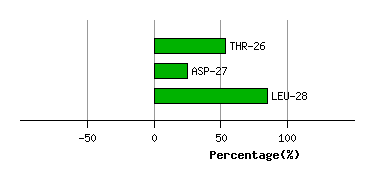
Graph shows rotational transition at bending residues and can be used
to identify hinge bending residues.
Probably only informative for interdomain rotations greater than 20 degrees
Residue
iResidue
i+1Distance of hinge axis to residue i in
(A) Distance of hinge axis to residue i in
(A) Change in
(deg) Change in
(deg) Angle of psi(i) axis to hinge axis
(deg) Angle of psi(i) axis to hinge axis
(deg) Percentage Progress
HIS-45
LYS-46
12.9
13.1
-2.8
8.1
82.8
81.4
113.0
LYS-46
PHE-47
10.4
10.3
6.5
1.9
151.0
151.5
-78.1
PHE-47
PHE-48
7.6
7.6
3.2
-17.4
98.5
98.5
121.7
PHE-48
ILE-49
7.0
6.5
12.5
-7.5
146.0
159.1
-183.4
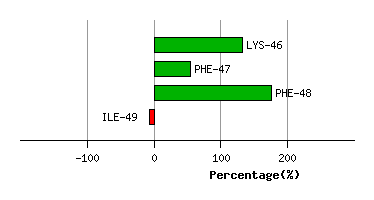
Graph shows rotational transition at bending residues and can be used
to identify hinge bending residues.
Probably only informative for interdomain rotations greater than 20 degrees
Residue
iResidue
i+1Distance of hinge axis to residue i in
(A) Distance of hinge axis to residue i in
(A) Change in
(deg) Change in
(deg) Angle of psi(i) axis to hinge axis
(deg) Angle of psi(i) axis to hinge axis
(deg) Percentage Progress
THR-106
GLY-107
3.7
3.9
1.8
-7.6
81.3
83.3
5.9
GLY-107
THR-108
0.5
0.8
-6.3
1.9
29.8
34.5
65.0
THR-108
ALA-109
2.8
2.9
-9.5
6.5
100.8
101.3
-51.2
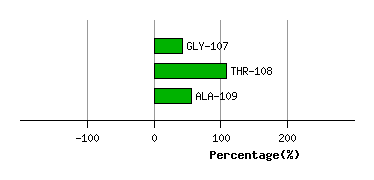
Graph shows rotational transition at bending residues and can be used
to identify hinge bending residues.
Probably only informative for interdomain rotations greater than 20 degrees
Residue
iResidue
i+1Distance of hinge axis to residue i in
(A) Distance of hinge axis to residue i in
(A) Change in
(deg) Change in
(deg) Angle of psi(i) axis to hinge axis
(deg) Angle of psi(i) axis to hinge axis
(deg) Percentage Progress
VAL-124
ALA-125
5.8
5.9
-4.7
-1.3
68.9
70.2
57.5
ALA-125
GLY-126
2.9
3.0
2.0
5.9
78.3
81.7
55.5
GLY-126
ALA-127
3.8
4.0
-1.9
1.2
56.8
58.5
-28.6
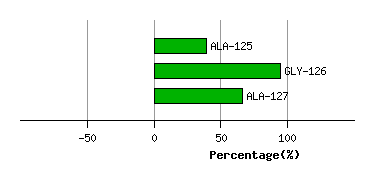
Graph shows rotational transition at bending residues and can be used
to identify hinge bending residues.
Probably only informative for interdomain rotations greater than 20 degrees