Pumilio 1
(All numbering and residues are taken from first PDB file)
![]()
![]()
Bending Residue Dihedral Analysis
Residue
iResidue
i+1Distance of hinge axis to residue i in
(A) Distance of hinge axis to residue i in
(A) Change in
(deg) Change in
(deg) Angle of psi(i) axis to hinge axis
(deg) Angle of psi(i) axis to hinge axis
(deg) Percentage Progress
HIS-1030
GLN-1031
6.6
6.6
-22.2
30.2
96.7
99.2
17.8
GLN-1031
HIS-1032
9.3
9.6
-23.3
23.0
101.8
93.7
5.9
HIS-1032
THR-1033
8.0
8.2
6.4
-2.0
121.5
124.8
-0.9
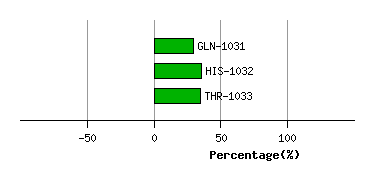
Graph shows rotational transition at bending residues and can be used
to identify hinge bending residues.
Probably only informative for interdomain rotations greater than 20 degrees
Residue
iResidue
i+1Distance of hinge axis to residue i in
(A) Distance of hinge axis to residue i in
(A) Change in
(deg) Change in
(deg) Angle of psi(i) axis to hinge axis
(deg) Angle of psi(i) axis to hinge axis
(deg) Percentage Progress
GLN-1038
ASP-1039
10.7
10.9
9.8
-10.8
161.9
161.9
7.2
ASP-1039
GLN-1040
10.1
10.0
-7.7
3.7
84.2
86.2
11.0
GLN-1040
TYR-1041
11.4
11.4
6.2
-6.4
103.5
103.8
3.1
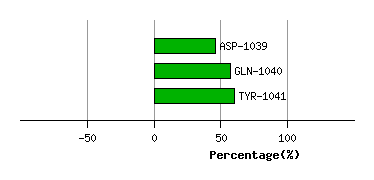
Graph shows rotational transition at bending residues and can be used
to identify hinge bending residues.
Probably only informative for interdomain rotations greater than 20 degrees
Residue
iResidue
i+1Distance of hinge axis to residue i in
(A) Distance of hinge axis to residue i in
(A) Change in
(deg) Change in
(deg) Angle of psi(i) axis to hinge axis
(deg) Angle of psi(i) axis to hinge axis
(deg) Percentage Progress
ASN-1043
TYR-1044
7.1
6.8
5.4
-4.7
87.7
89.5
-15.6
TYR-1044
VAL-1045
7.2
6.8
10.0
-3.9
91.1
92.1
8.8
VAL-1045
ILE-1046
3.8
3.3
-7.8
6.8
22.6
19.2
12.3
ILE-1046
GLN-1047
2.6
2.2
6.8
-7.8
125.0
124.9
-11.5
GLN-1047
HIS-1048
6.0
5.5
0.4
2.1
82.0
80.6
-9.4
HIS-1048
VAL-1049
6.8
6.4
4.9
-3.1
123.0
124.8
-18.3
VAL-1049
LEU-1050
5.1
4.8
-12.7
10.0
14.1
16.2
17.9
LEU-1050
GLU-1051
5.5
5.0
-6.0
14.0
79.3
82.2
-4.3
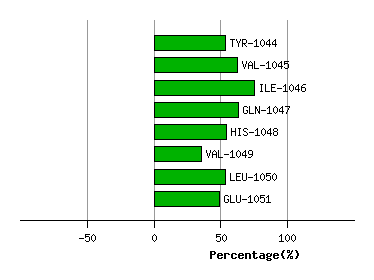
Graph shows rotational transition at bending residues and can be used
to identify hinge bending residues.
Probably only informative for interdomain rotations greater than 20 degrees
Residue
iResidue
i+1Distance of hinge axis to residue i in
(A) Distance of hinge axis to residue i in
(A) Change in
(deg) Change in
(deg) Angle of psi(i) axis to hinge axis
(deg) Angle of psi(i) axis to hinge axis
(deg) Percentage Progress
ARG-1054
PRO-1055
9.7
10.1
6.9
9.3
37.3
48.1
112.3
PRO-1055
GLU-1056
8.5
8.7
-8.2
11.4
88.9
82.0
37.7
GLU-1056
ASP-1057
8.8
9.0
-13.7
6.2
51.3
57.0
12.7
ASP-1057
LYS-1058
6.4
6.5
1.2
-2.4
66.2
63.2
-58.9
LYS-1058
SER-1059
3.9
4.1
1.7
4.3
50.4
49.9
20.8
SER-1059
LYS-1060
4.0
4.6
-8.0
2.4
65.4
68.1
-7.3
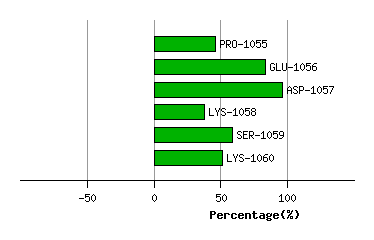
Graph shows rotational transition at bending residues and can be used
to identify hinge bending residues.
Probably only informative for interdomain rotations greater than 20 degrees